
3 Example Scripts That Reduce Repetitive Tasks When Graphing
Do you regularly create graphs and charts? If so, you can reduce repetitive tasks by using example scripts to speed things up. Learn more.| Golden Software
The Hidden Bubbles: Quantifying Greenhouse Gas Emissions From Degrading Permafrost The Earth’s permafrost is a vast expanse of frozen ground that holds a massive reservoir of greenhouse gases. As global temperatures rise and the permafrost thaws, these gases—primarily methane—are released into the atmosphere. But how do you measure these emissions, [...]| Golden Software
Do you regularly create graphs and charts? If so, you can reduce repetitive tasks by using example scripts to speed things up. Learn more.| Golden Software
Need to Enhance Understanding of Your Data? Create a Fly-Through of Your 3D Model. When it comes to communicating complex surface and subsurface data, 3D models are a powerful tool. They help your stakeholders visualize complicated spatial relationships, spot patterns, and better understand the scope of a problem or solution. [...]| Golden Software
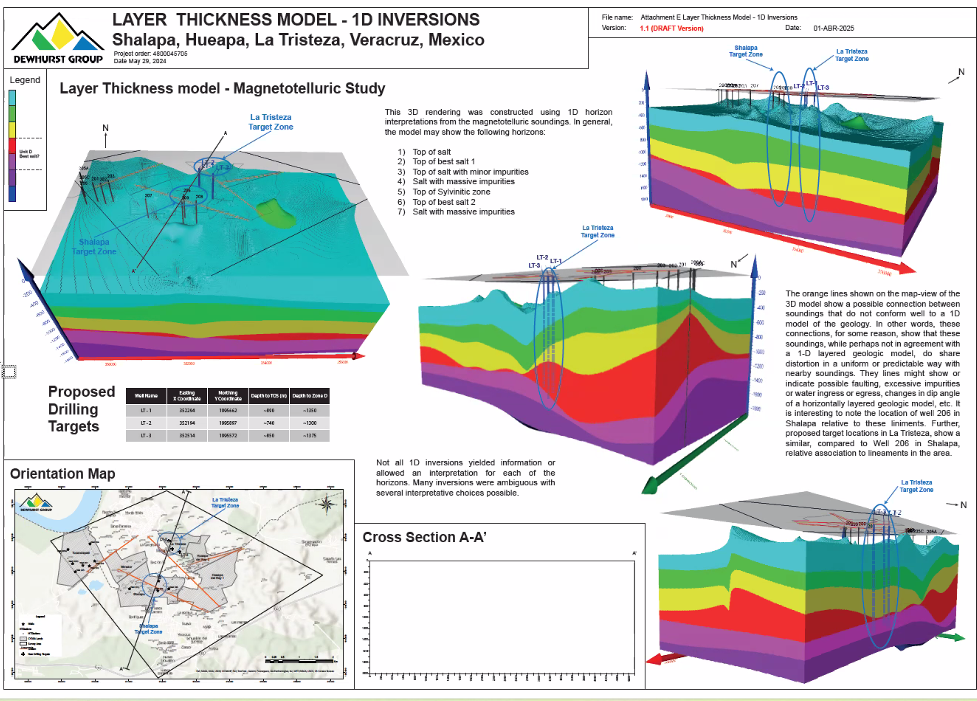
Recently, the Dewhurst Group had to take an untraditional data analysis approach to create a monster map that visualized pure salt in Mexico.| Golden Software
How Professor Mine Dogan Is Preparing Future Scientists at WMU’s Hydrogeology Field Camp Every summer, Western Michigan University (WMU) hosts a Hydrogeology Field Camp, an immersive, hands-on experience designed to equip the next generation of scientists with the tools they’ll need to succeed in the field. The camp lets students [...]| Golden Software

How can you know your grid is accurate? There's only one good solution: validating your grid results. Learn how to do it in Surfer!| Golden Software
The Change Beneath the Surface: Tracking the Decrease of Freshwater Clam Species Diversity in Iowa Archaeologist and Iowa State University Professor Matthew Hill recently completed a research project investigating the health of freshwater clams in the Des Moines River, a 525-mile waterway that eventually joins the Mississippi River near Keokuk, [...]| Golden Software
3 Types of Scripts That Can Automate Some of Your Map-Making Workflow When it comes to mapping, automation can be a game-changer. But when you hear the word “scripting,” which is the method used to jumpstart automation, your first thought might be, “That’s not for me.” If you’re a geoscientist [...]| Golden Software
Show Your Layers Clearly: Bring Your 3D Models Into Full View with Multiple Light Sources Creating clear, accurate, and compelling 3D models is vital when you’re communicating complex subsurface information. But if your model includes multiple layers at different depths—like surfaces, drillholes, or isosurfaces—then you know that visual clarity can [...]| Golden Software
101 Guide to a Durov Diagram: Its Purpose, Benefits, Use Cases, and the Best Way to Create & Recreate One Quickly Creating a Durov diagram from scratch is no small feat. Even with the right software, there’s still the matter of finding where the plot lives in the interface, formatting [...]| Golden Software
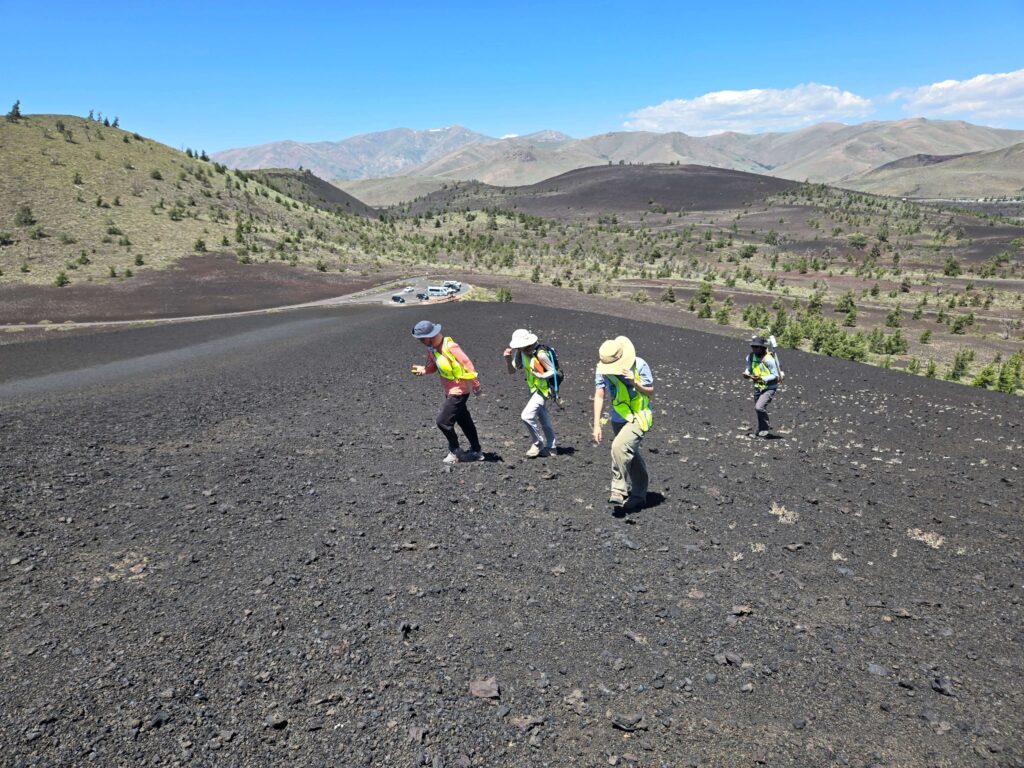
Get a glimpse into the University of South Florida's field camp, which includes a geophysics course in Idaho, advanced equipment, and Surfer.| Golden Software
Golden Software sells 2D & 3D data modeling, mapping, graphing and analysis software solutions for engineers and scientists in environmental services, engineering consulting, resource exploration, and university settings.| Golden Software
There are several common mistakes you may make when designing maps and graphs. You can avoid them using data visualization best practices.| Golden Software
