Outliers. There are as many opinions on what to do about them as there are causes for them. In this webinar, we’ll explore the different types of outliers, methods for figuring out which type you have, whether they’re influential, and what to do about them.| The Analysis Factor
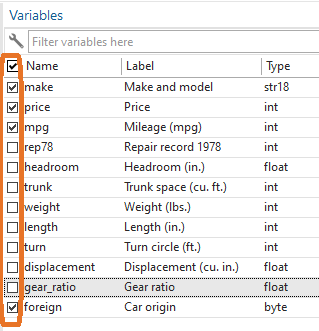
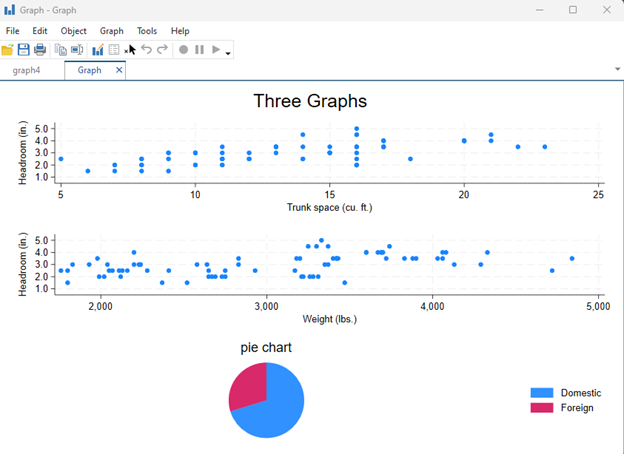
Once you’ve imported data into Stata the next step is examining the data before you work on building a model or running any tests.| The Analysis Factor
One question that seems to come up pretty often is: What is the difference between logistic and probit regression? Well, let’s start with how they’re the same: Both are types of generalized linear models. This means they have this form: Both can be used for modeling the relationship between one or more numerical or categorical […]| The Analysis Factor
I see most researchers struggling with statistical analysis at this level. And you’ll see it’s a big one. As is true at each stage, this one is composed of three components. Statistical Knowledge: Linear Models in its Entirety Data Analysis Skills Software Skills: One Statistical Software Until its Easy Luckily, they go together, so it’s […]| The Analysis Factor
The term “non-parametric” has come to imply that we don’t need to make any assumptions about the specific distribution of our residuals, but it certainly doesn’t mean that there are no assumptions at all.| The Analysis Factor
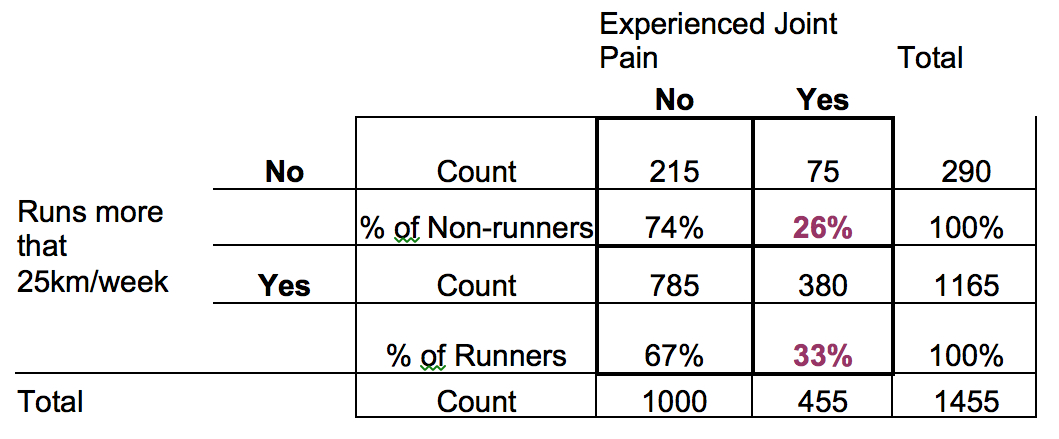
You may have heard of McNemar tests as a repeated measures version of a chi-square test of independence. This is basically true, but they test different hypotheses.| The Analysis Factor
After talking with enough researchers, I've come to a few conclusions about why some researchers feel embarrassed about their statistical abilities, why they shouldn't, and what they need to become a proficient and confident statistical analyst. The post Essentials of Craft: How to Become a Skilled and Confident Statistical Analyst appeared first on The Analysis Factor.| The Analysis Factor
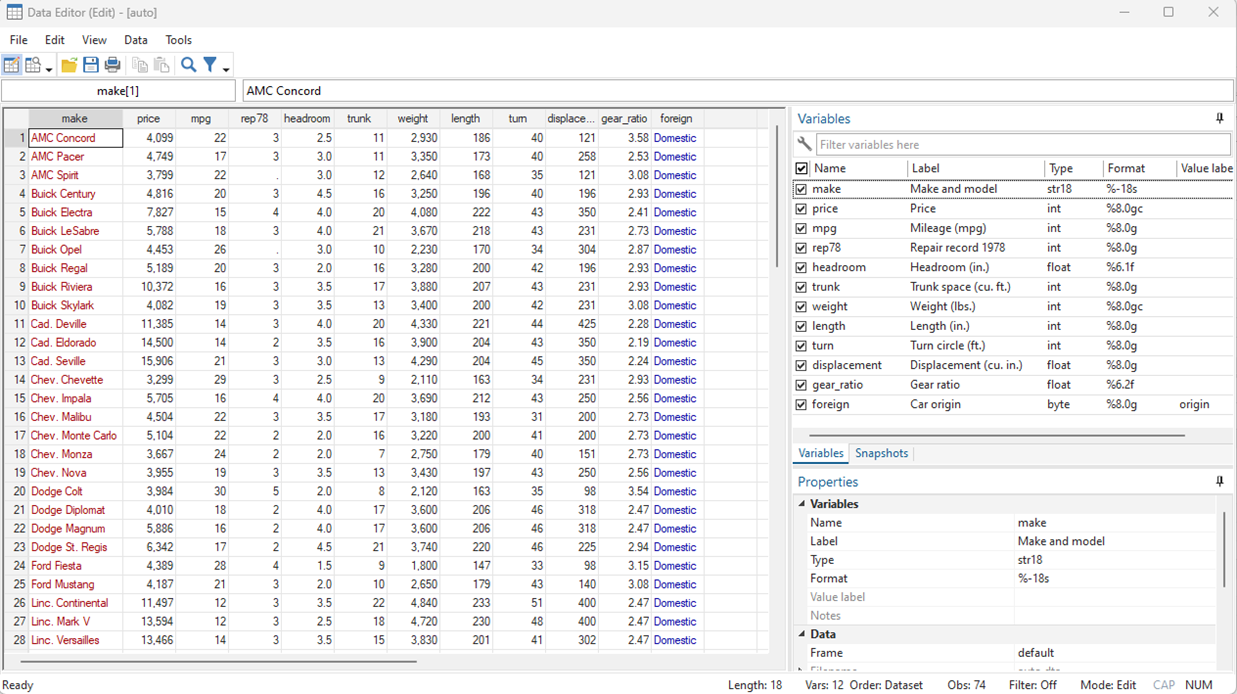
We’ll now teach you to make your variables more approachable by adding labels. Note the different sections for “Label” and “Value label”. A label just provides a description of the variable, while a value label matches numbers to words. The post Getting Started with Stata Tutorial #13: Changing variable labels using label, encode, and decode appeared first on The Analysis Factor.| The Analysis Factor
Conquer Statistics with Confidence: Get Expert Help for Your Research Today! Access a team of experienced statisticians ready to guide you step-by-step—without expensive retainers or confusing jargon Give Me Access! Dear researcher, Are you feeling stuck and overwhelmed by the challenges of statistical analysis? You’re not alone. Many researchers find themselves spending countless […]| The Analysis Factor
Learn count models along with a cohort of fellow researchers. Use these when the outcome in a model or group comparison is a discrete count.| The Analysis Factor
Splines provide a useful way to model relationships that are more complex than a simple linear function. The post Member Training: Cubic Splines appeared first on The Analysis Factor.| The Analysis Factor
Across the bottom are the observed data values, sorted lowest to highest. You can see that just like on the histogram, the values range from about -2.2 to 2.2. (Note, these are standardized residuals, so they already have a mean of 0 and a standard deviation of 1. If they didn’t, the plot would standardize them before plotting). The post Anatomy of a Normal Probability Plot appeared first on The Analysis Factor.| The Analysis Factor
When you can interpret regression coefficients for all types of predictor variables, you can build more sophisticated and accurate models.| The Analysis Factor