Custom Mobile App Performance Dashboards | Embrace
Enhance performance with custom dashboards. Visualize metrics, make data-driven decisions. Unlock app potential with Embrace!| Embrace
Enhance performance with custom dashboards. Visualize metrics, make data-driven decisions. Unlock app potential with Embrace!| Embrace

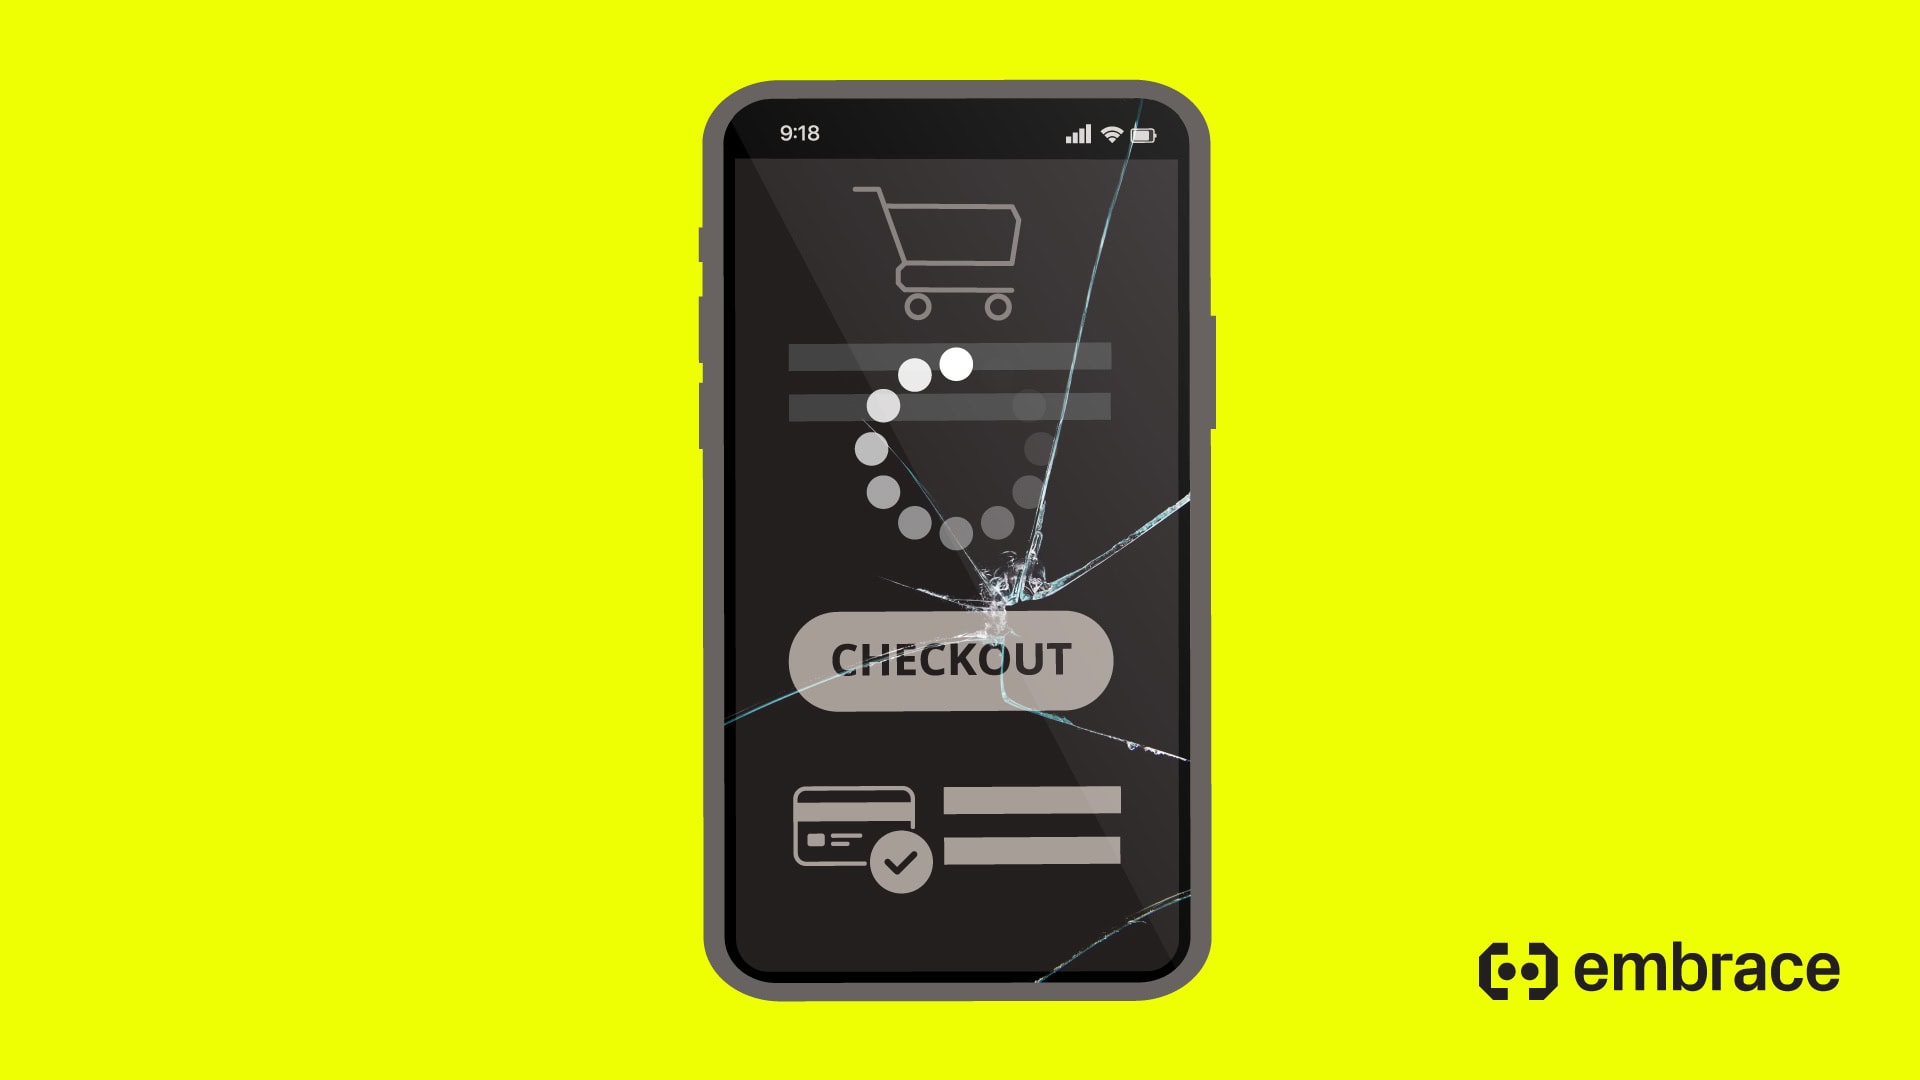
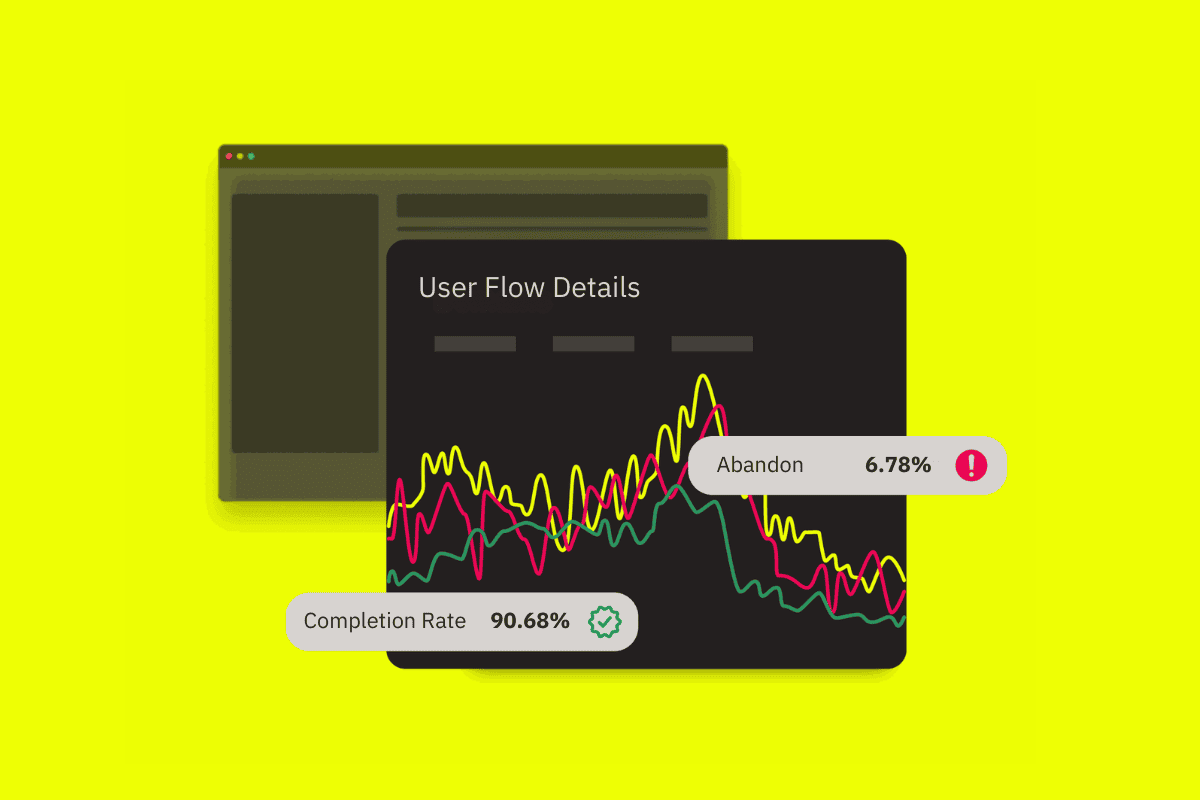
Optimize critical user flows for app success. Gain insights, monitor metrics, make data-driven optimizations. Optimize with Embrace!| Embrace
Discover the only mobile-first observability solution built on OpenTelemetry, uniting mobile telemetry with backend performance data for DevOps and SRE teams. Elevate app performance insights, resolve user-impacting issues, and gain a truly unified observability view.| Embrace
Keep your users connected with Embrace's Network Monitoring. Ensure a seamless user experience. Supercharge your app's network monitoring now!| Embrace
Solve your toughest issues with Embrace's full-context Error Tracking. Ensure a seamless user experience. Resolve errors efficiently with Embrace!| Embrace
Never solve the same crash twice with Embrace's intelligent Crash Reporting. Stay ahead of crashes and deliver excellence with Embrace!| Embrace
In this OpenTelemetry expert panel, we discuss the new Browser SIG, key challenges of adapting OTel for the frontend, and how web developers can get started with OpenTelemetry.| Embrace
Observability teams often ask why we don’t show monolithic traces for issues like slow startups. While they theoretically reveal all services involved, they’re hard to interpret, and distract from what’s critical: the mobile experience context.| Embrace
Embrace now automatically calculates a severity score for every JavaScript exception to help you prioritize the most critical issues affecting your users.| Embrace
Our updated Release Health page gives engineers an effective launchpad to evaluate performance across app releases, examine trends, and quickly spot regressions. Plus, Embrace's Release Health connects you with the details you need to start troubleshooting a release issue – fast.| Embrace
In this OpenTelemetry expert panel, we discuss the challenges of collecting telemetry in mobile apps, why mobile developers struggle with observability, and what the current support for OpenTelemetry is on Android and Swift.| Embrace
In the age of AI, user experience strategy cannot stand still. The interface is not disappearing, but it is shifting into adaptive, intent-driven territory.| Embrace
See exactly what’s slowing your pages down and impacting your end users with Embrace's new Page Load Insights feature for Web RUM.| Embrace
Embrace has opened a proposal to donate a Kotlin implementation of the OpenTelemetry specification that can be used in Kotlin Multiplatform projects.| Embrace
Introducing Embrace's new Overview Page, your engineering team's launchpad for mobile and web observability.| Embrace
Our dashboard gives you a plethora of metrics to provide full visibility into the health and stability of your app. Rather than clicking through pages filled with metrics to get a basic understanding of key issues within your app, we've rolled-up relevant issues into our Issues page. Navigate to the page by selecting Issues in the left hand menu on the dashboard.| embrace.io
Embrace tags each stack frame by the most specific matching condition in your CODEOWNERS file. This is then rolled up to the Crash, and Crash Group levels.| embrace.io
The Embrace Dashboard provides real-time tools for developers to observe all user-impacting production data from their apps. Developers use Embrace to solve issues, measure performance, and explore high-dimensional app scenarios.| embrace.io
Embrace offers real user monitoring (RUM) for mobile and web, helping engineering teams quickly identify issues, boost app performance, and improve user experience with full visibility and context.| Embrace
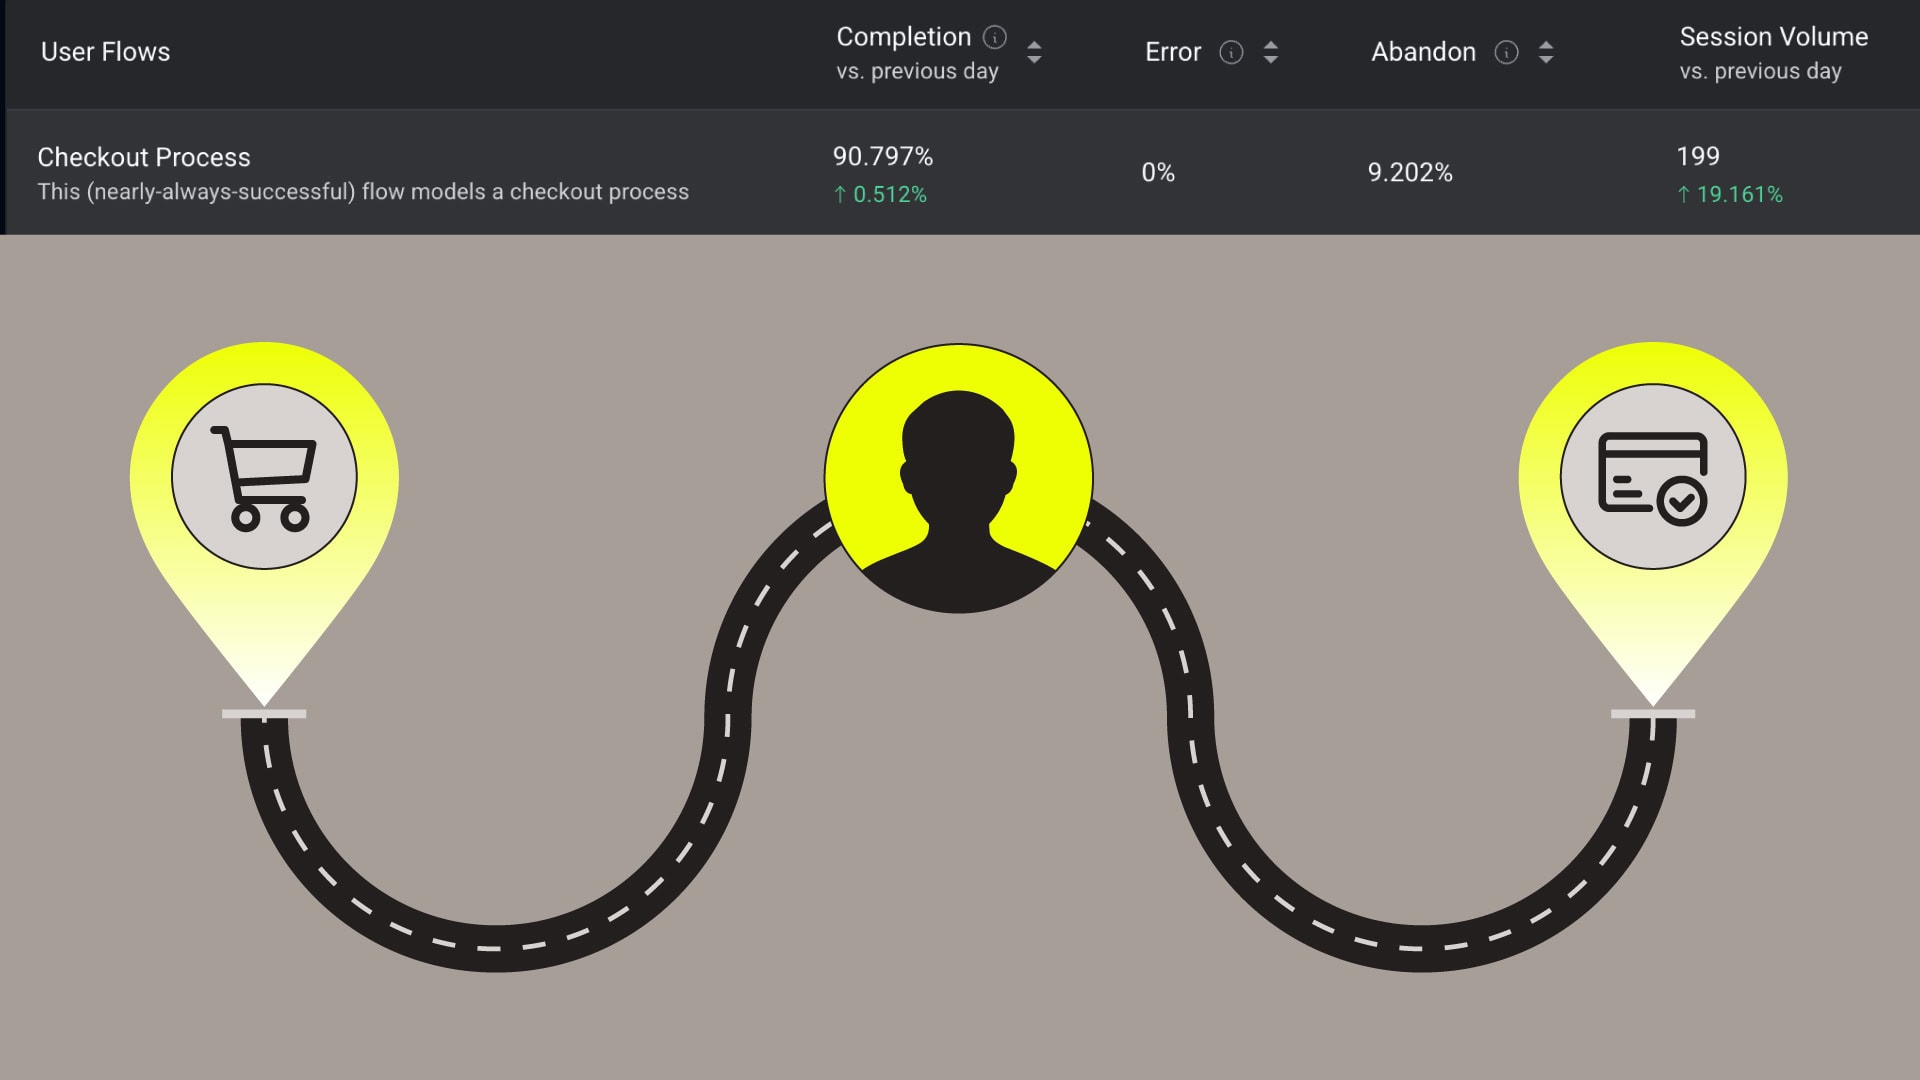
Learn how, and why, to create User Flows that target the mission-critical parts of your mobile and web applications.| Embrace
Diagnosing network errors doesn't need to be an opaque process with finger-pointing between mobile and backend teams.| embrace.io
| embrace.io
Learn about the metrics and queries supported by the Embrace API| embrace.io
Learn about the Embrace <> Grafana Cloud integration| embrace.io
Add logging to your Android application using Breadcrumbs with the Embrace SDK| embrace.io
| embrace.io
The primary page shows all root spans in your app, as well as summary metrics like count, error rate, percentiles of duration, and changes from a previous version.| embrace.io
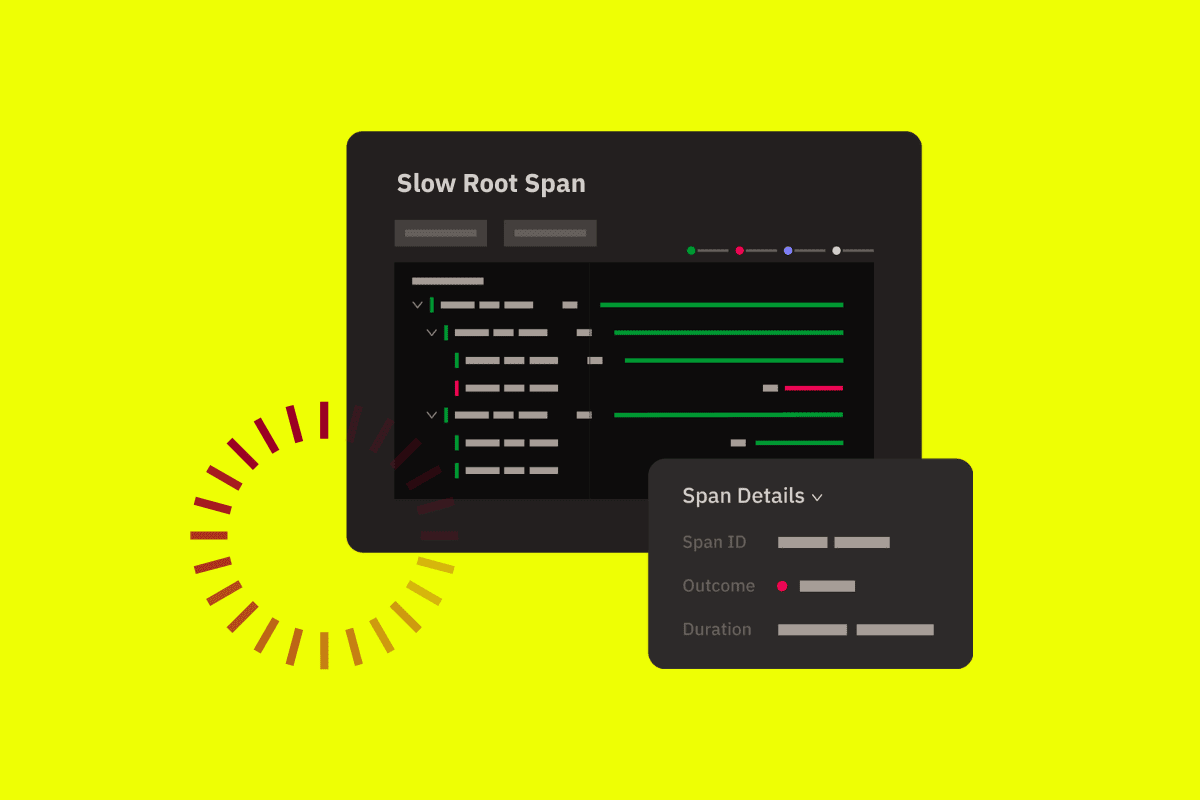
Slow Root Spans is a new feature by Embrace that lets engineers set custom thresholds for the latency of their spans and better optimize app performance.| Embrace
With Embrace’s User Journeys feature, you can move beyond simple funnel analysis and gain deeper insights into how users experience your application. User Journeys allow engineering teams to track and analyze all of the events in a journey that a user takes, providing valuable data on performance impacts and behavioral trends.| embrace.io
Get readable stacktraces in production with the Embrace Gradle Plugin and auto-instrument your app| embrace.io
Adopt Embrace’s OTel SDKs to gather the data essential for modernizing your stack with a mobile-first approach.| Embrace
Monitor mobile SLOs to capture real user impact with Embrace. Improve app performance, resolve issues faster, and connect mobile data with backend observability for full visibility.| Embrace
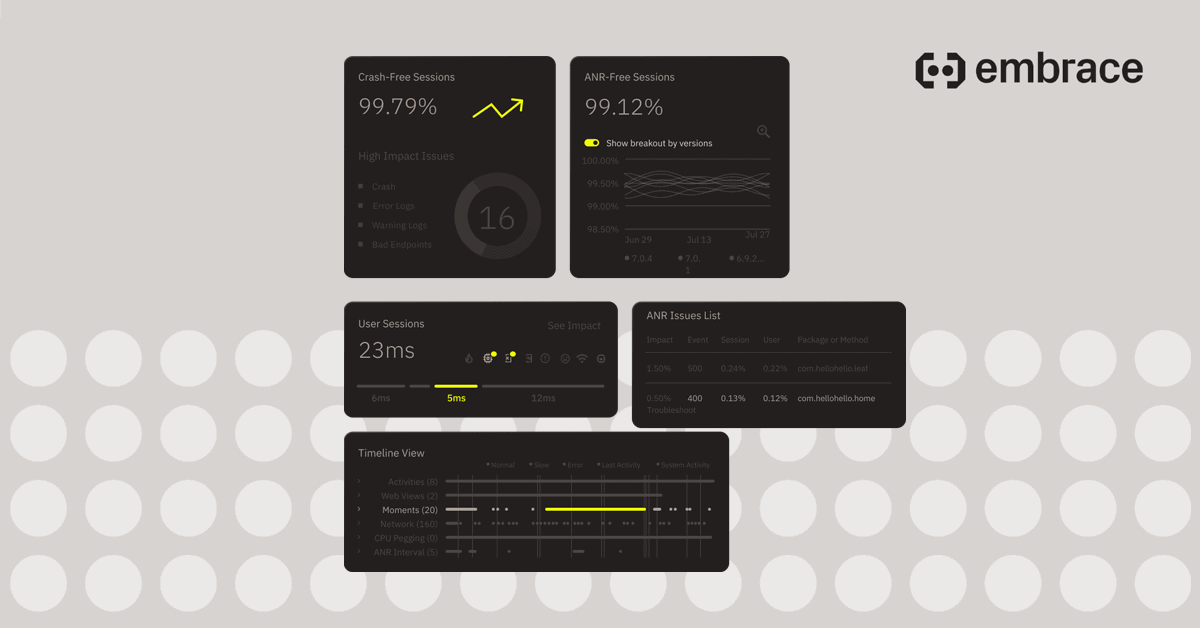
Quickly identify and resolve mobile app crashes, bugs, and ANRs with Embrace’s user session insights for optimized app performance and a seamless user experience.| Embrace
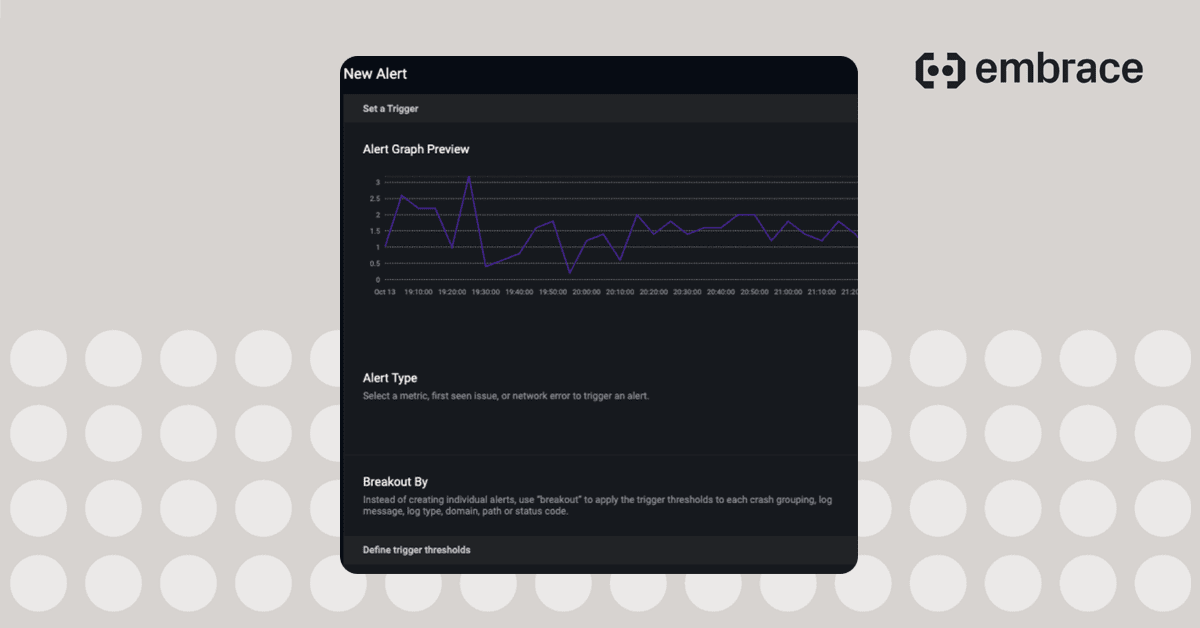
Get instant alerts for mobile app performance. Take action for seamless user experience. Receive alerts with Embrace!| Embrace
OpenTelemetry metrics are quantitative measurements that track system performance over time, such as request counts or memory usage.| Embrace
The most common causes of app crashes include memory management issues, network connectivity problems, insufficient device storage, operating system compatibility conflicts, unhandled exceptions, and background process interference.| Embrace
This guide breaks down the leading SaaS tools for network performance monitoring, helping you identify the best fit for your unique requirements.| Embrace
Monitoring tracks system health using predefined metrics, telemetry collects raw data, and observability enables deep analysis to diagnose both known and unknown issues.| Embrace
Observability best practices for mobile apps include implementing structured logging, collecting performance metrics (such as app startup time and crash rates), and using distributed tracing to monitor user journeys.| Embrace
Automatically capture the performance of various aspects of the app| embrace.io
Stay updated with insights in mobile app performance. Discover tips, news to optimize your app. Explore our blog now!| Embrace
Embrace's User Sessions allow developers to recreate user activity with detailed data, helping identify and resolve issues efficiently.| embrace.io

Embrace and Bitrise's webinar connects release and production processes for mobile developers, creating faster releases and flawless user experiences.| Embrace
Gain deep insights with Embrace's User Session Insights. Optimize your app for an exceptional user experience. Elevate your app's performance today!| Embrace
Explore Embrace's new User Journeys platform capability and connect the dots between reliability and user engagement.| Embrace
With Embrace's new User Journeys platform capability, engineers can bridge the gap between product analytics and technical observability.| Embrace
We're thrilled to announce that Jason Robinson has joined Embrace as our Chief Revenue Officer, and he will continue to scale our go-to-market strategy and help even more companies harness the power of user-focused observability to drive real business outcomes.| Embrace
Learn the differences between traditional observability approaches and user-centric solutions when it comes to troubleshooting a mobile app issue.| Embrace
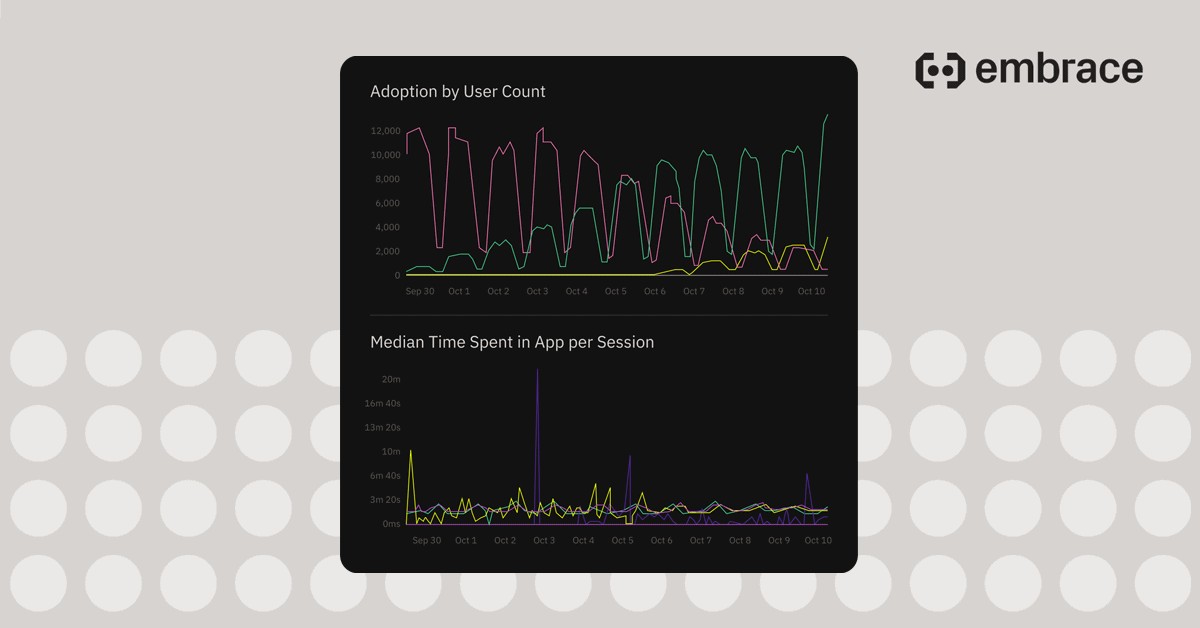
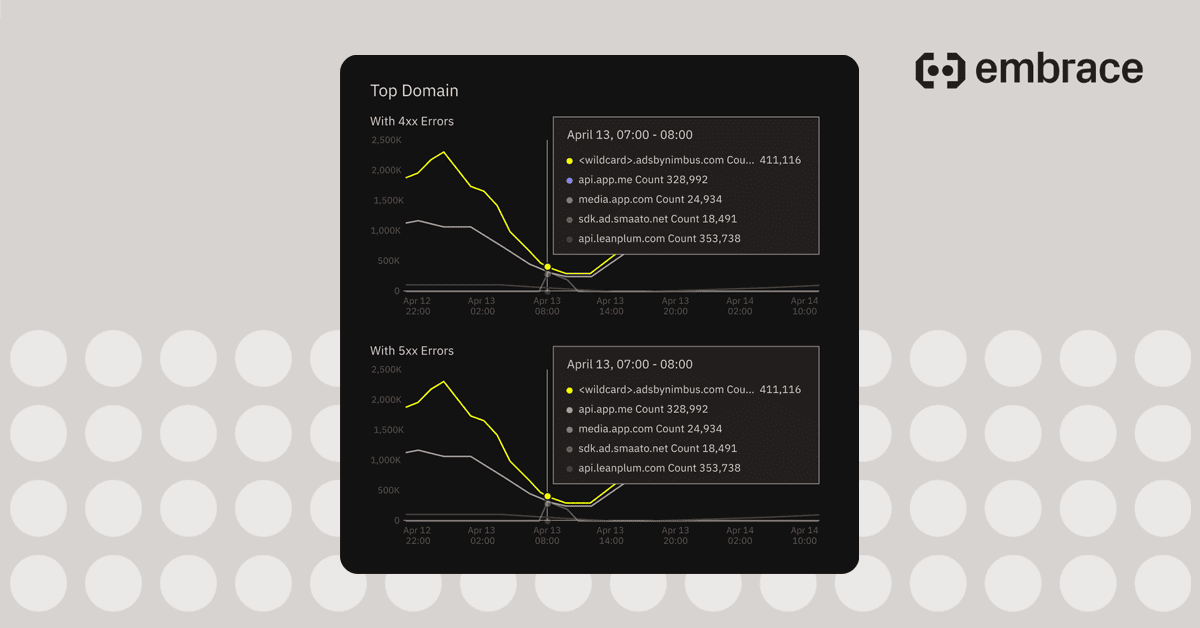
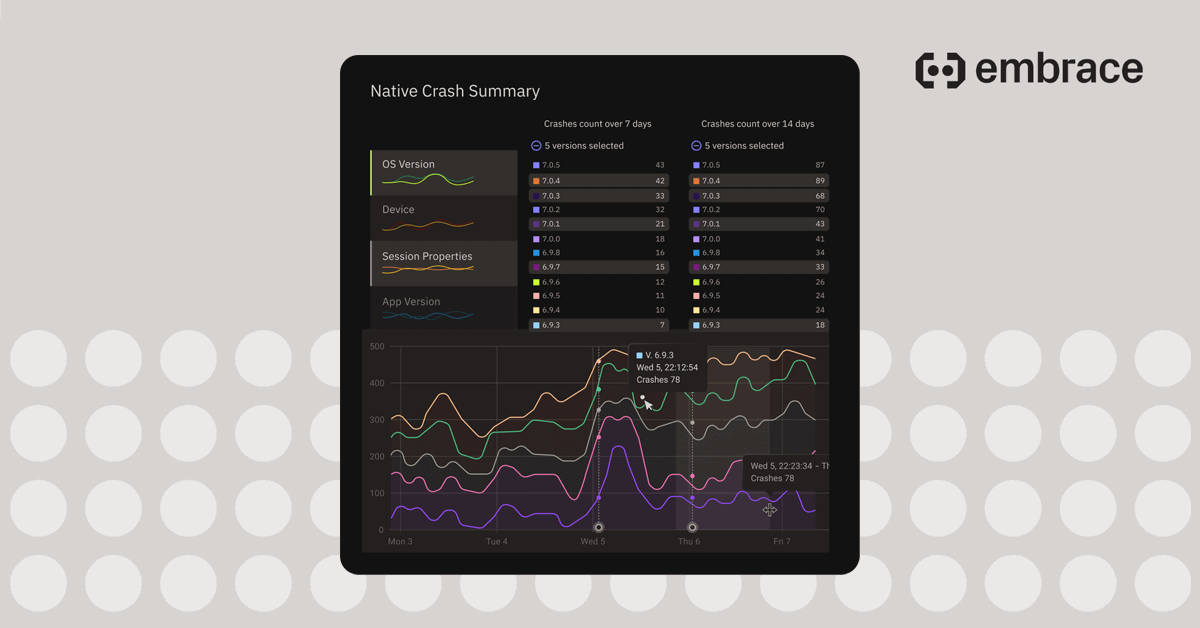
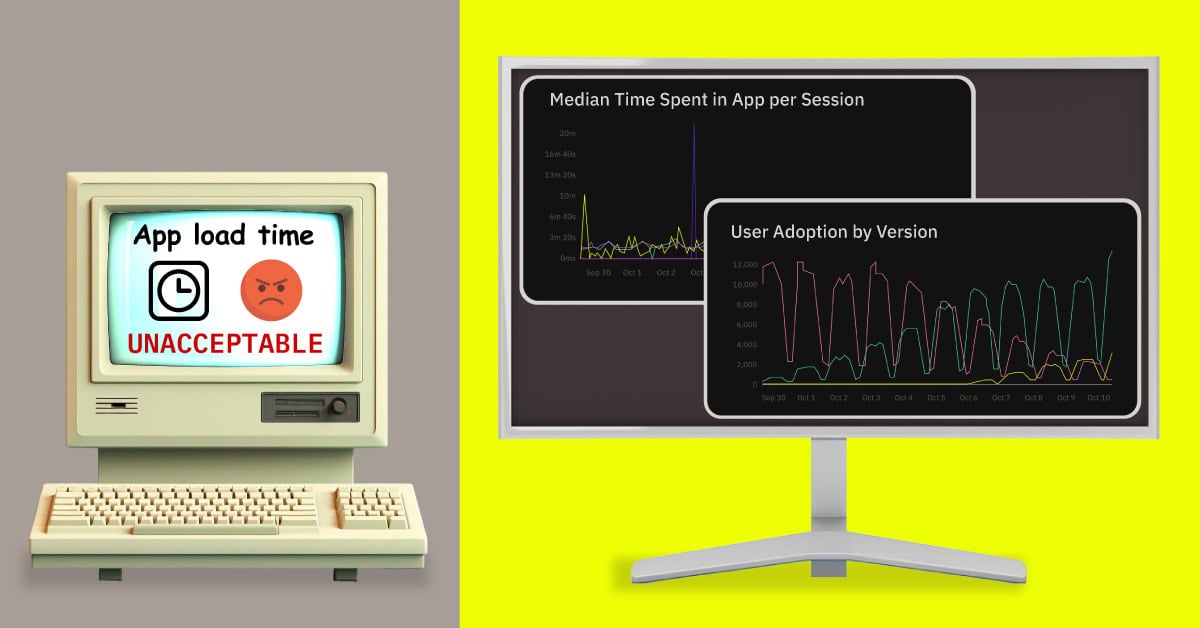
In addition to our pre-built dashboards for topics like Crashes, Logs, and Network Requests, each project can create Custom Dashboards. In these dashboards, you can create new analyses. For example, you can visualize a time series of Crash data segmented by app-version, or get a ranking of Logs filtered by a specific property.| embrace.io
Seamlessly configure Embrace’s behavior in Android apps, with access to the source code of the plugin itself.| Embrace
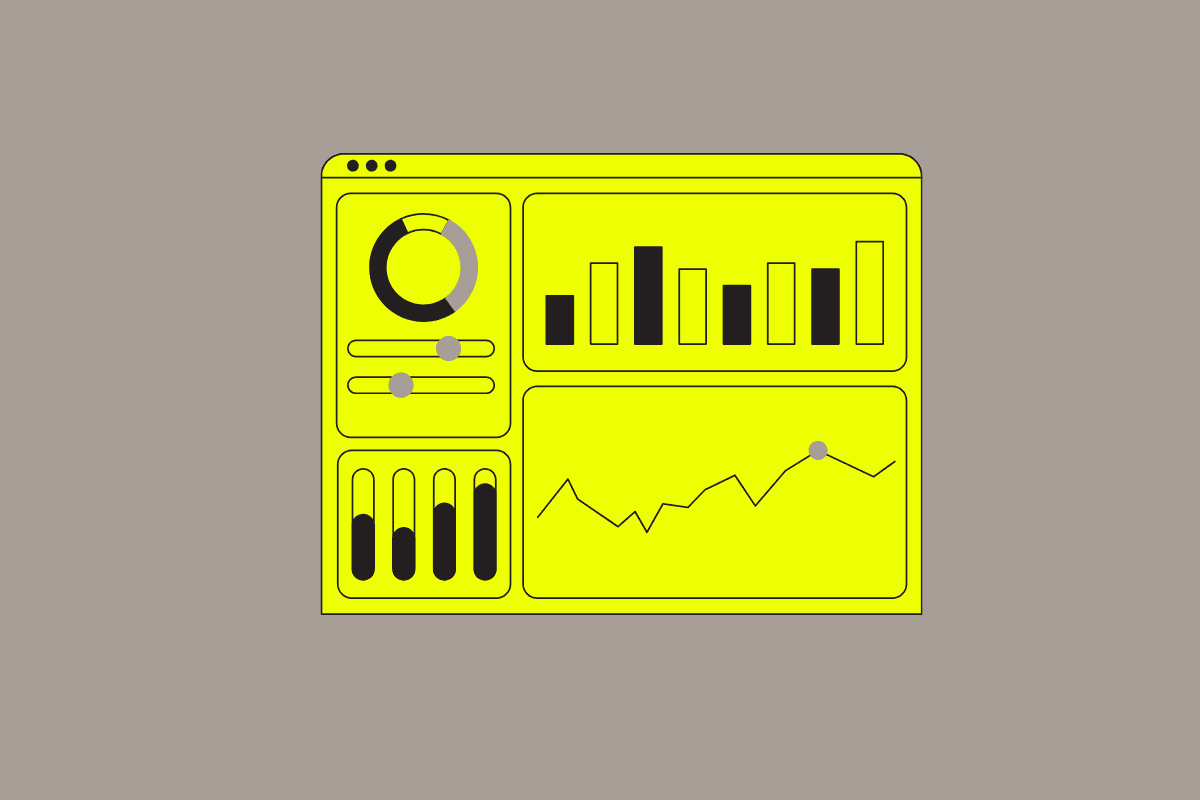
Embrace's Custom Dashboards have undergone a major upgrade, with new chart types, better searchability, advanced querying, and more.| Embrace
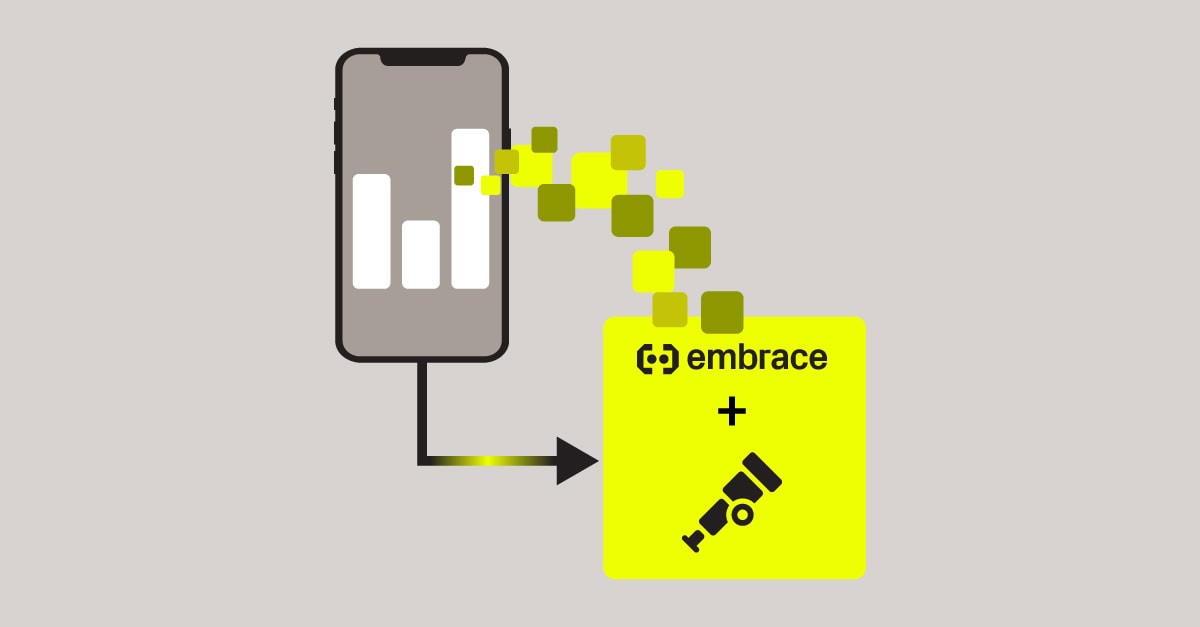
Embrace builds metrics out of the individual technical operations that make up user activity, so you can solve real issues.| Embrace
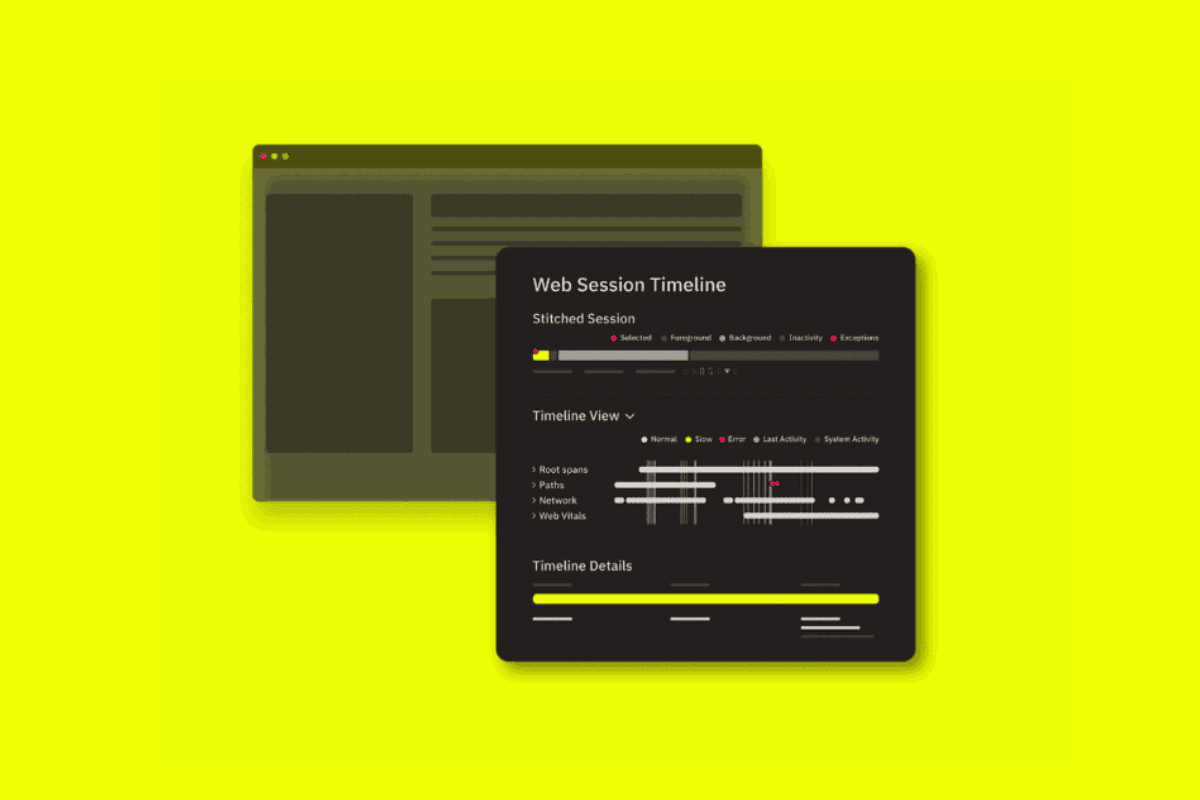
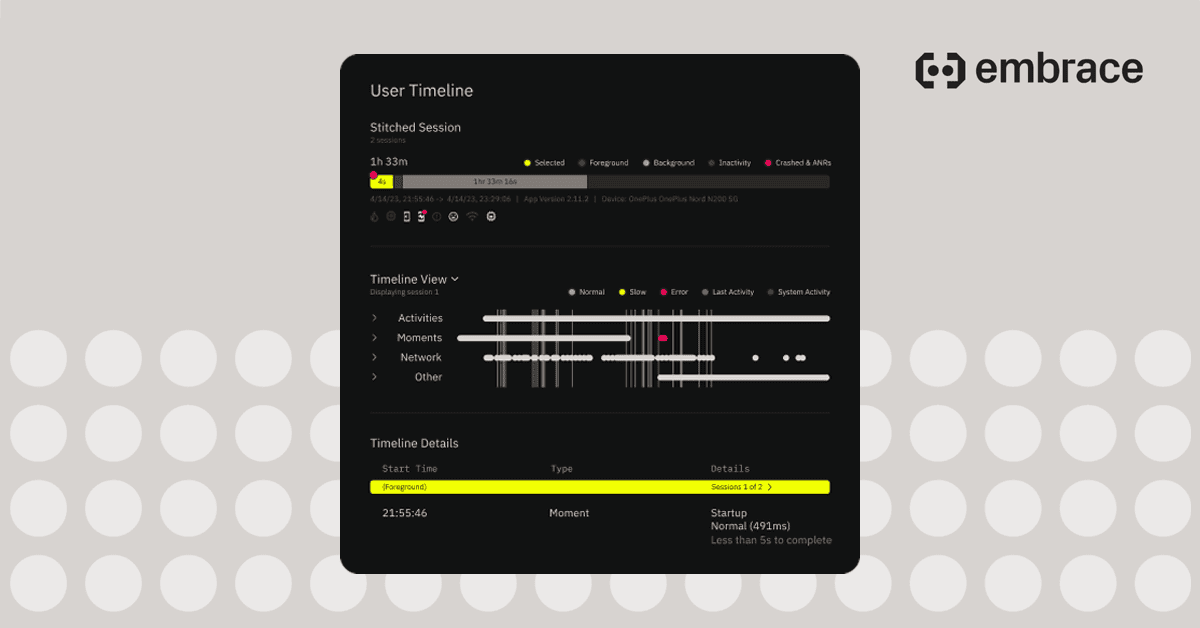
Embrace Web RUM's User Timeline feature helps web devs optimize their apps by providing a full trail of technical and behavioral events.| Embrace
Embrace now automatically instruments spans across the different processes that makeup both warm and cold mobile app startup.| Embrace
Embrace combines open-source SDKs with an analysis dashboard to help the entire engineering team understand exactly what is disrupting mobile user experiences.| Embrace
Learn about the metrics supported by the Custom Metrics API| embrace.io
Integrate OpenTelemetry with Embrace for seamless mobile observability. Standardize metrics, logs, and traces to optimize performance and enhance end-to-end visibility.| Embrace

Learn how to bridge the gap between mobile and DevOps teams with this on-demand devops.com webinar, presented by Embrace and Grafana experts.| Embrace
Learn about the Embrace Custom Metrics API to manage custom metrics| embrace.io
Learn how to use Embrace's OpenTelemetry SDK distribution to instrument traces in your app and export them to an observability backend.| Embrace
Learn how to use Embrace's open source OpenTelemetry distribution to instrument traces in your app and export them to an observability backend.| Embrace
Experience Embrace with a personalized demo. Gain insights, optimize performance. Request a demo now!| Embrace

Embrace's developer SDKs will now be available as open source code, starting with our Android SDK, and will also adhere to OpenTelemetry standards.| Embrace
Embrace is now part of the Amazon Web Services (AWS) Independent Software Vendor (ISV) Accelerate Program, making it easier for AWS customers to adopt our mobile observability platform.| Embrace

Embrace captures all the data from all the sessions of an app. Your Error Logs, successful and failing Network Requests, and screen tap locations are all recorded by the mobile app client. That’s a lot of data. Too much data to be constantly monitoring.| Embrace

Embrace's open-source SDKs leverage our unique expertise of mobile user experiences to give engineers a mechanism for transparent, portable, and extensible data collection that adheres to the OpenTelemetry standard.| Embrace

Enable full-stack observability with unparalleled visibility into mobile user experiences.| Embrace

Embrace is modernizing full-stack observability by providing open source, portable, and extensible mobile frameworks to OTel for site reliability and developer teams.| Embrace

