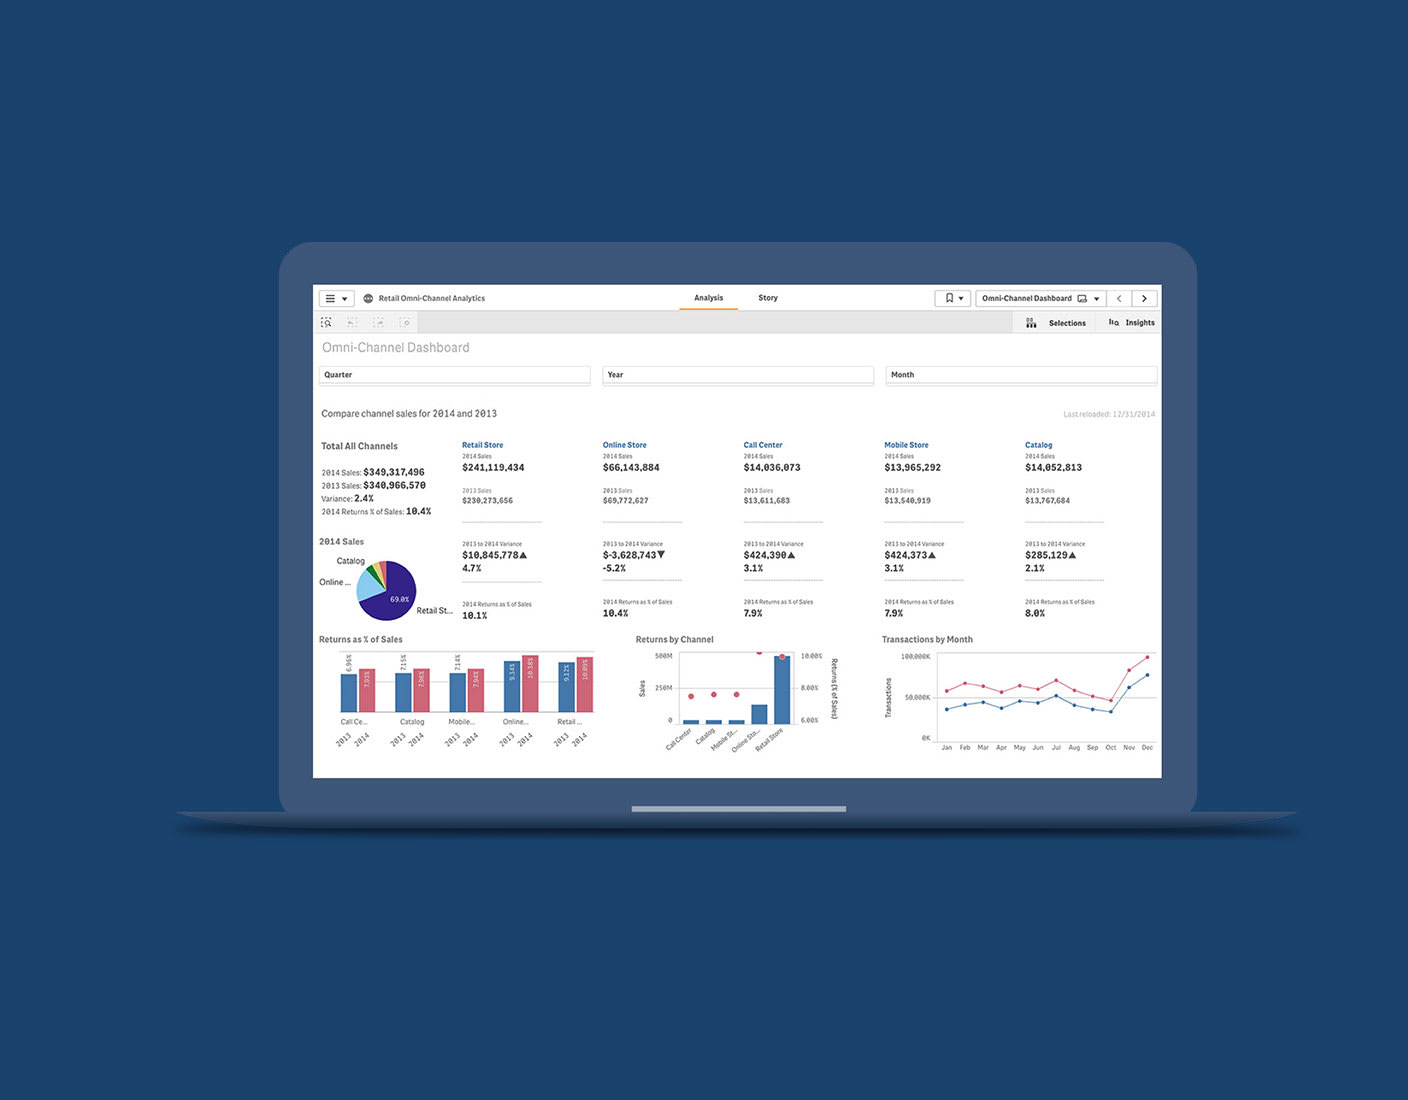
What is a KPI Report? Examples & Best Practices Guide
A KPI report is a visual representation of data that allows leaders to quickly see how their organizations are performing against key performance indicators.| Qlik
A KPI report is a visual representation of data that allows leaders to quickly see how their organizations are performing against key performance indicators.| Qlik
Marketing KPIs (key performance indicators) are quantifiable measures of performance for specific strategic objectives. See examples & templates.| Qlik
Interactive data visualization is the use of tools & processes to produce a visual representation of data which can be analyzed within the visualization.| Qlik

Data literacy drives powerful insights and critical business decisions — but most of the world can’t fully understand data. Ready to unlock your potential?| Qlik
Get the top KPIs for each department: Sales, Marketing, Operations, & more. KPI examples, templates and practical advice to help you define the right KPIs.| Qlik

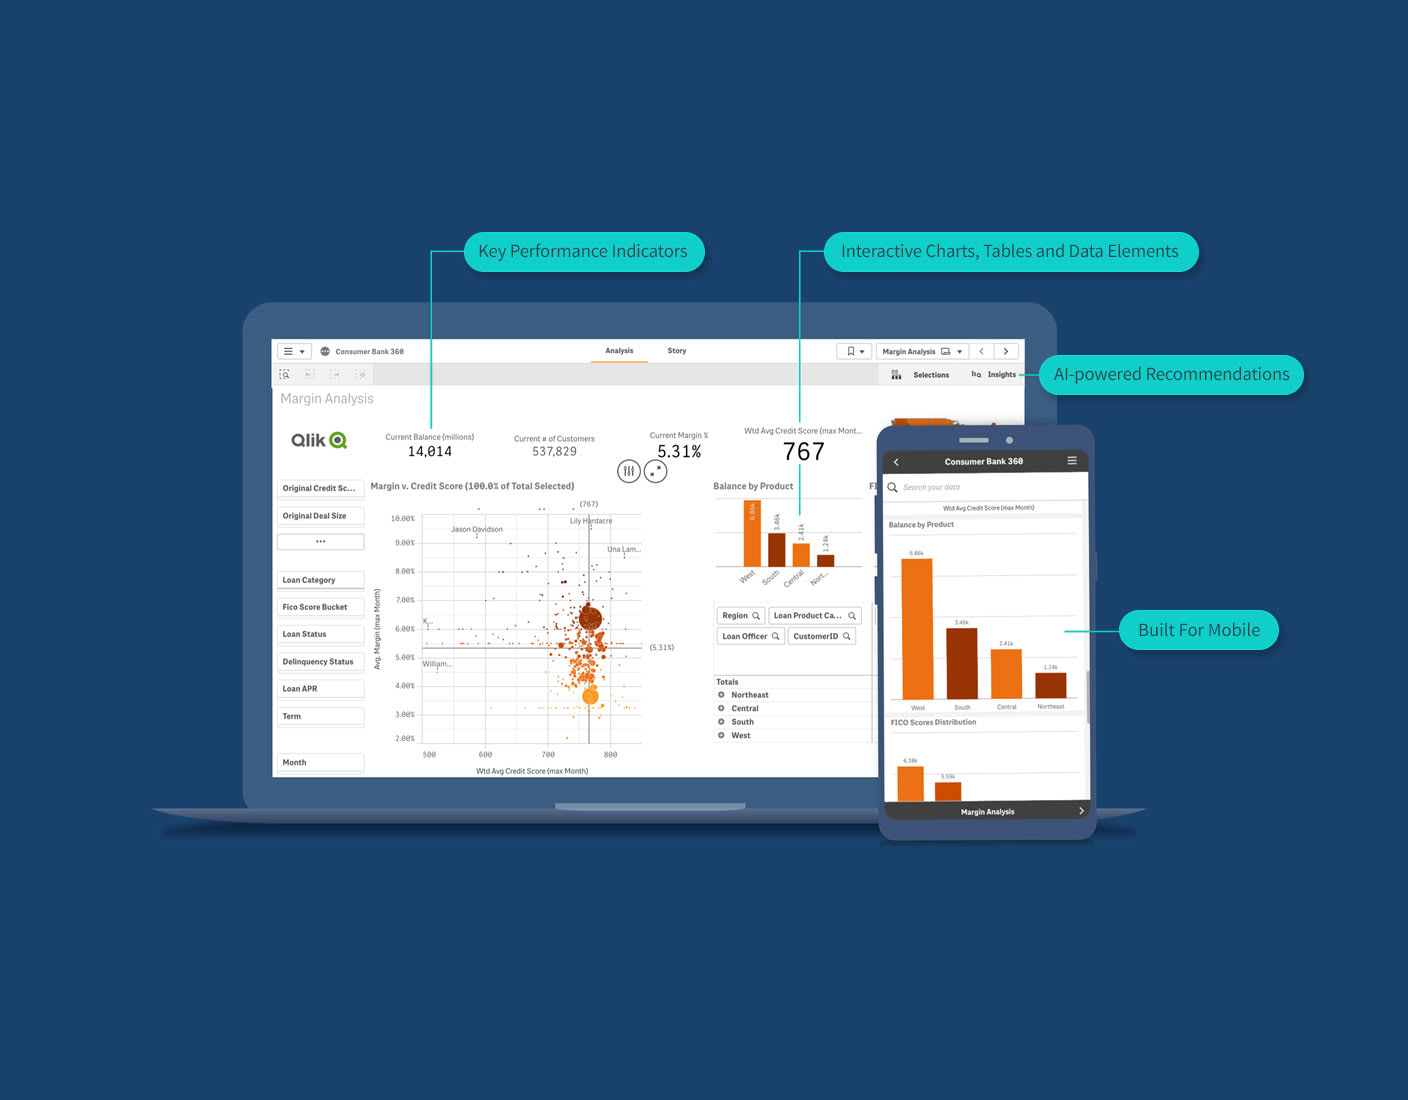
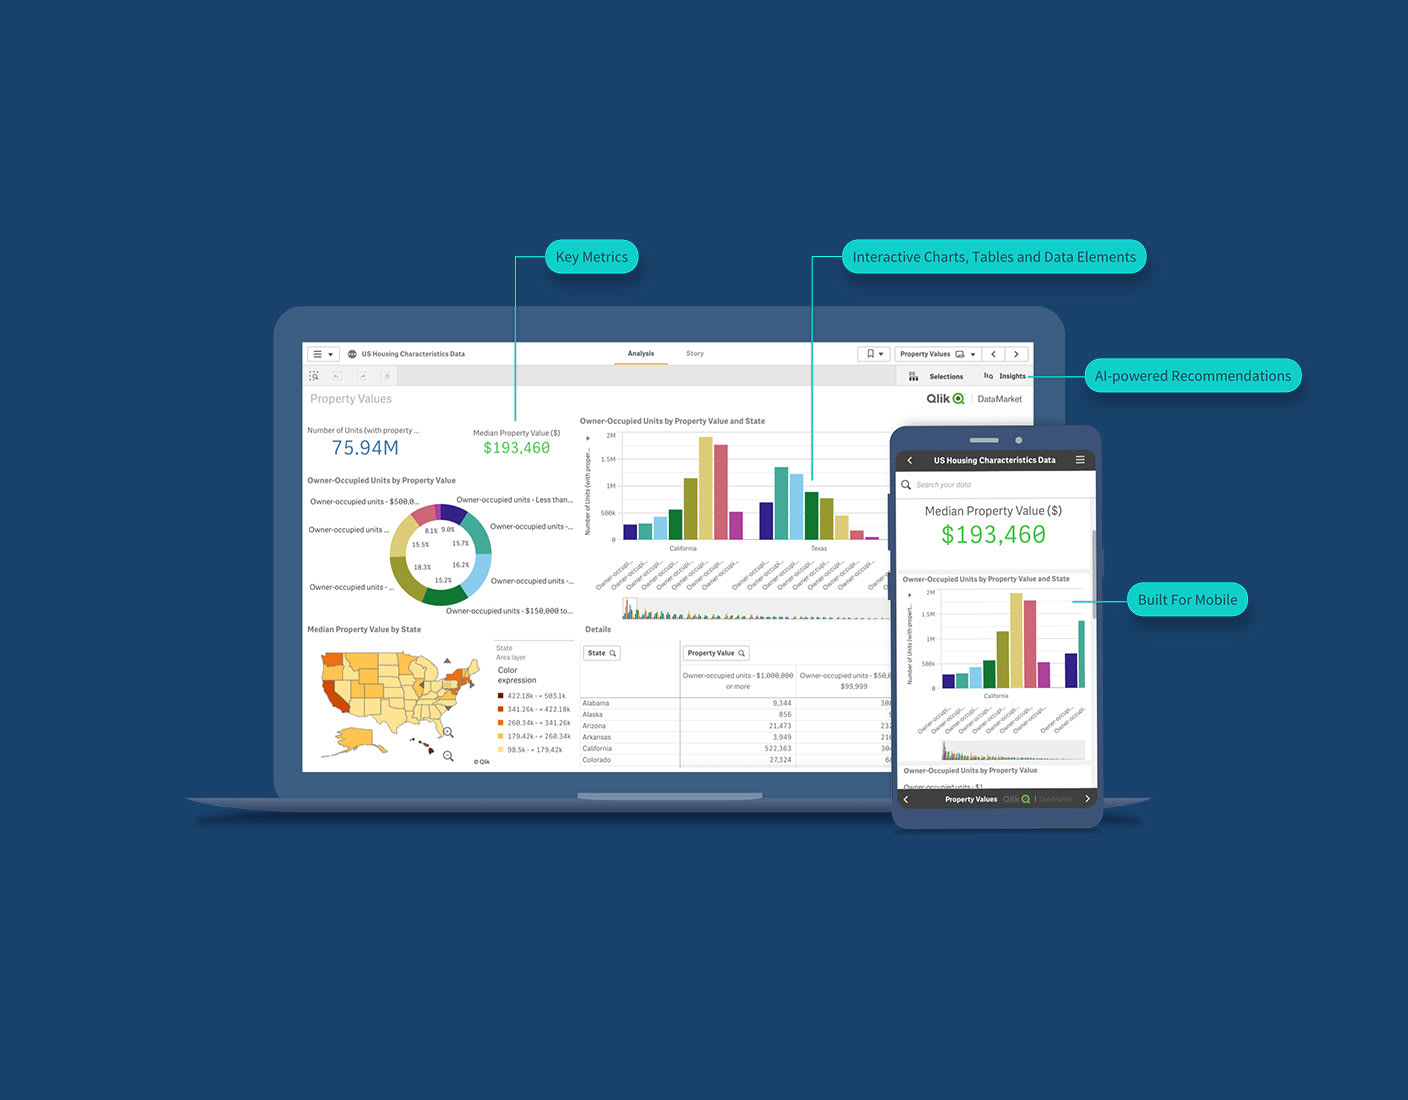
Watch free demo videos to see modern, interactive KPI dashboards in action.| Qlik
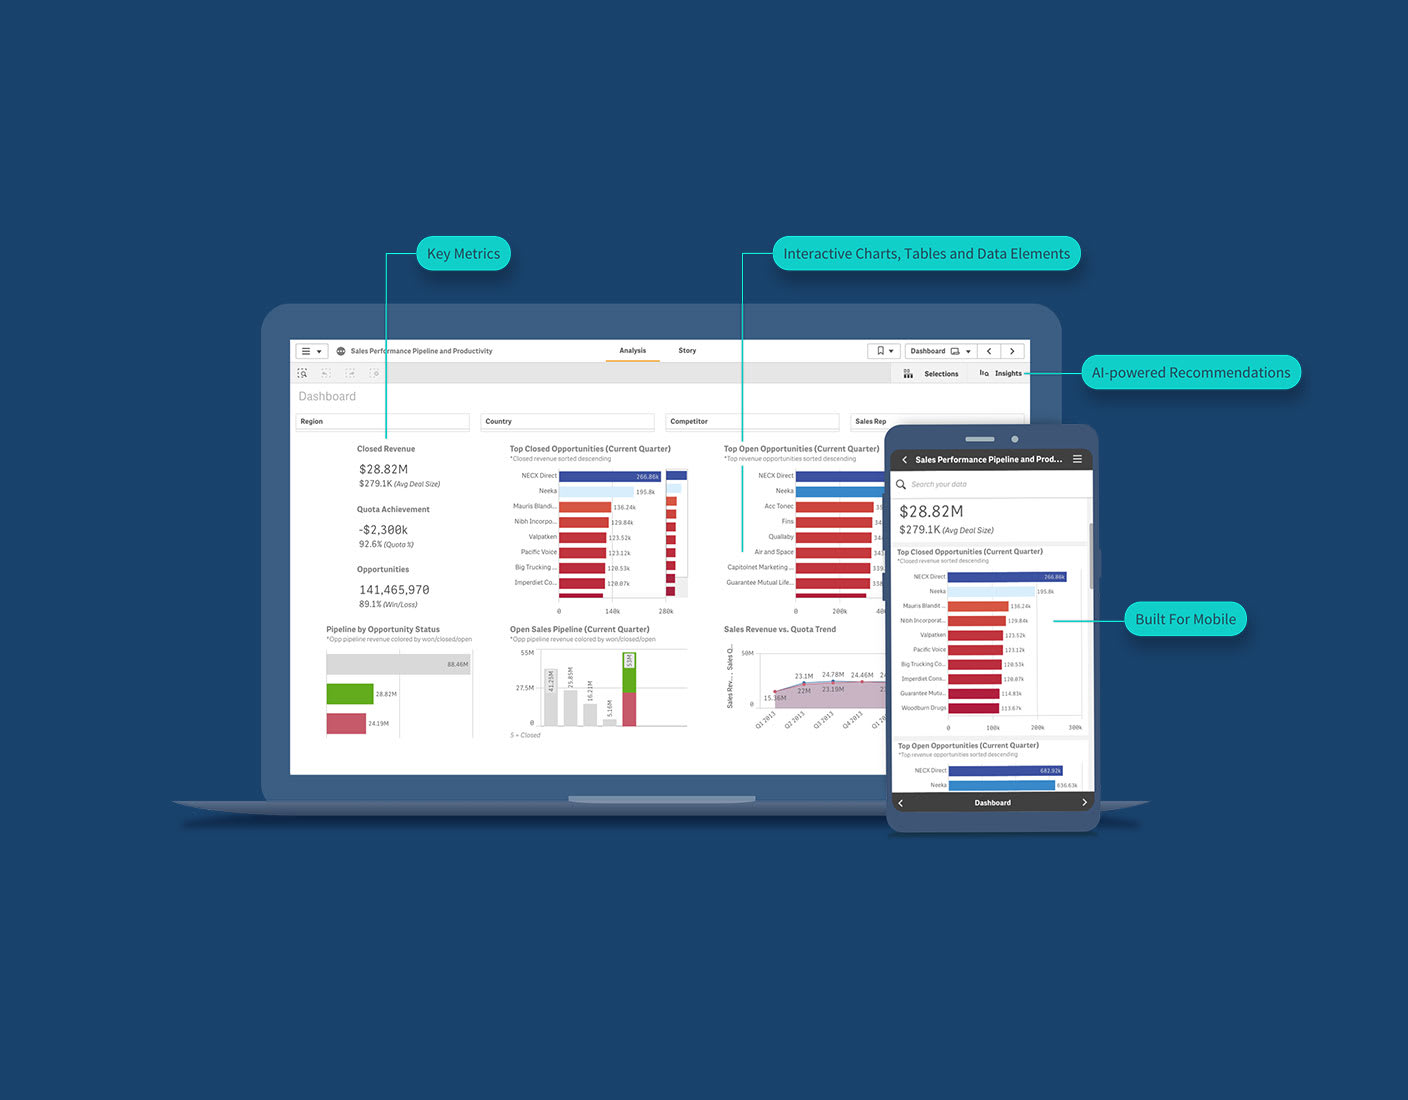
A sales dashboard is a business intelligence tool that allows sales teams to track, analyze and report on sales KPIs.| Qlik

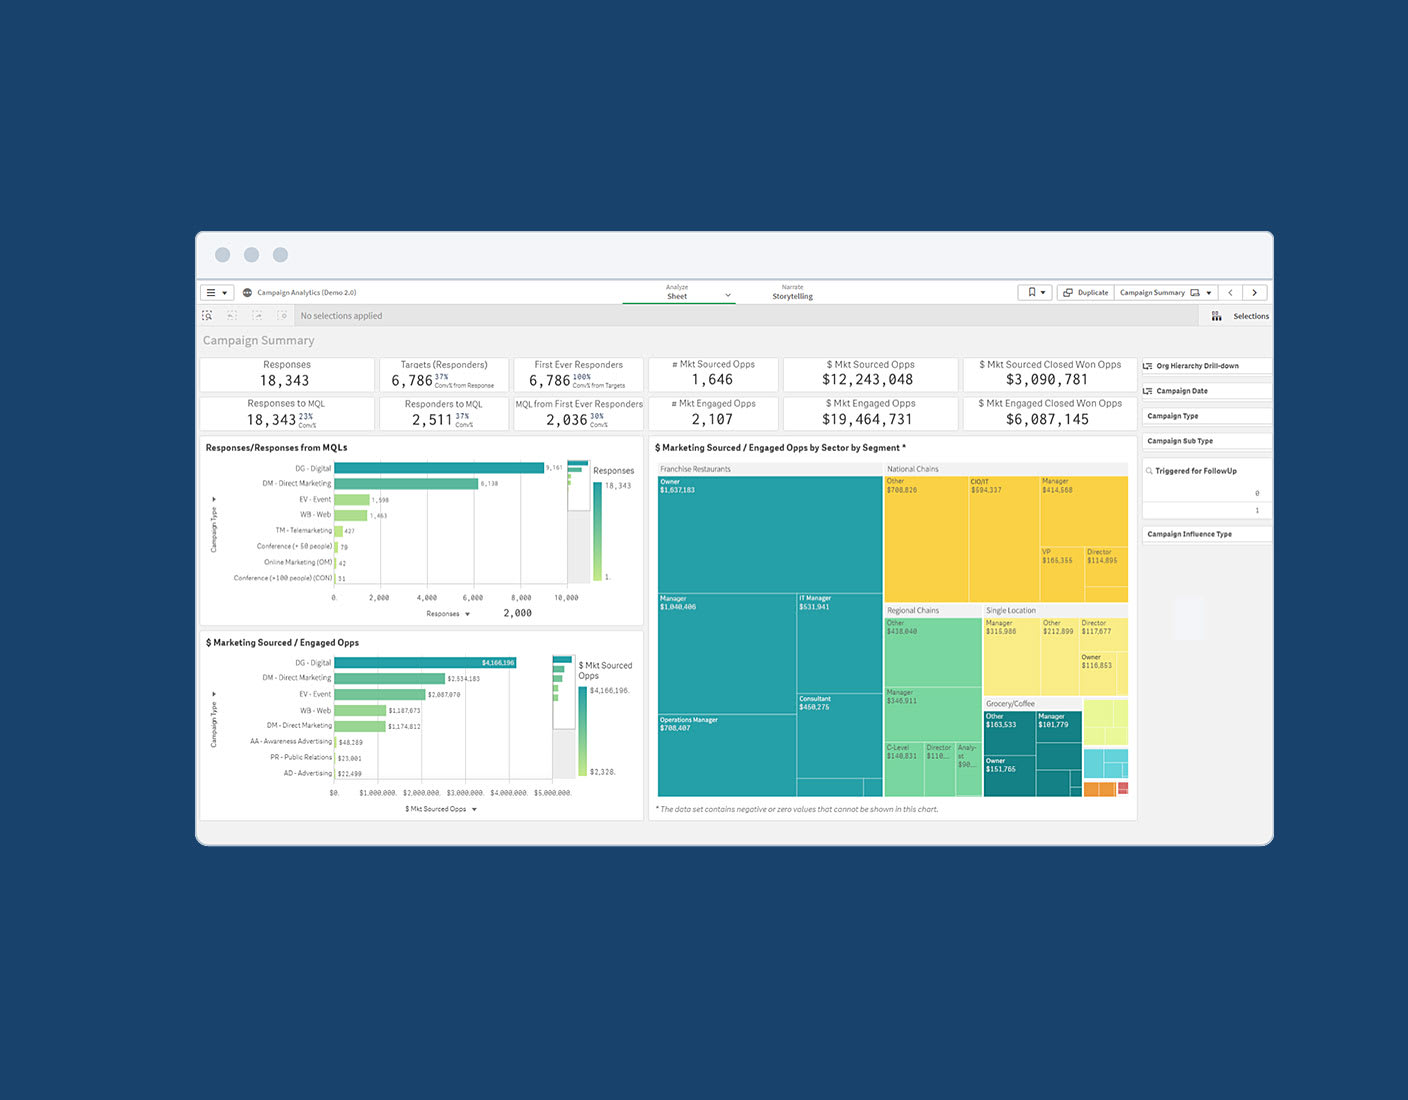
A marketing dashboard is a BI tool that allows marketing teams to track, analyze and report on marketing KPIs.| Qlik
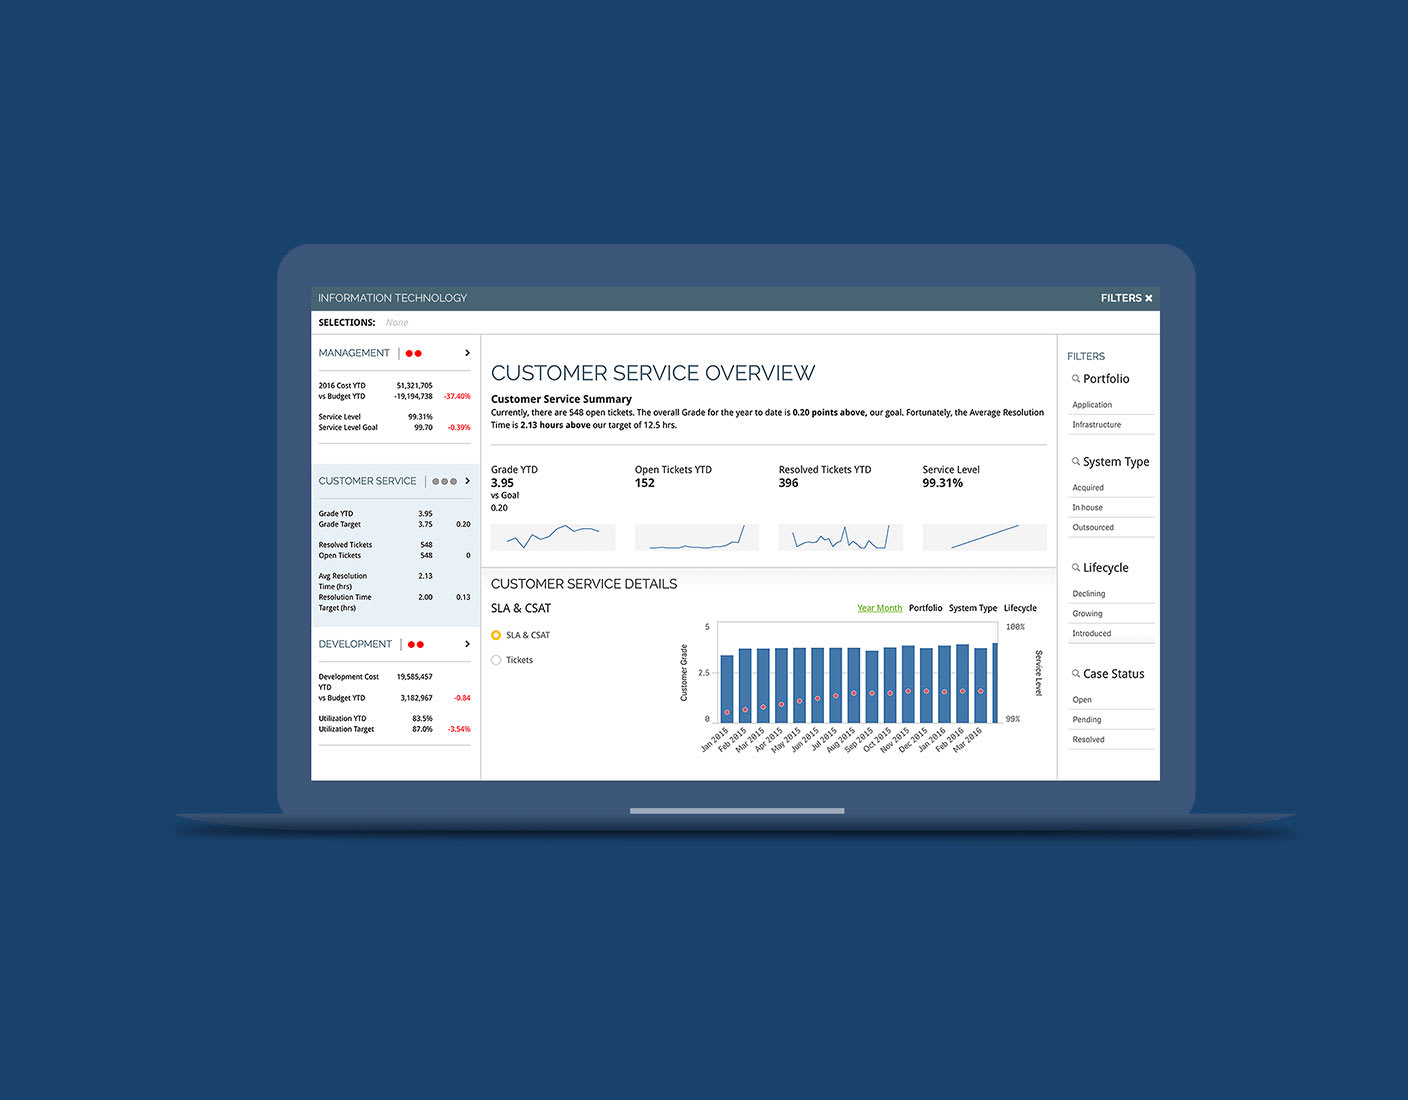
KPI dashboards are essential to modern business success. Learn the time-tested principles to design best-in-class dashboards to meet your key business goals.| Qlik
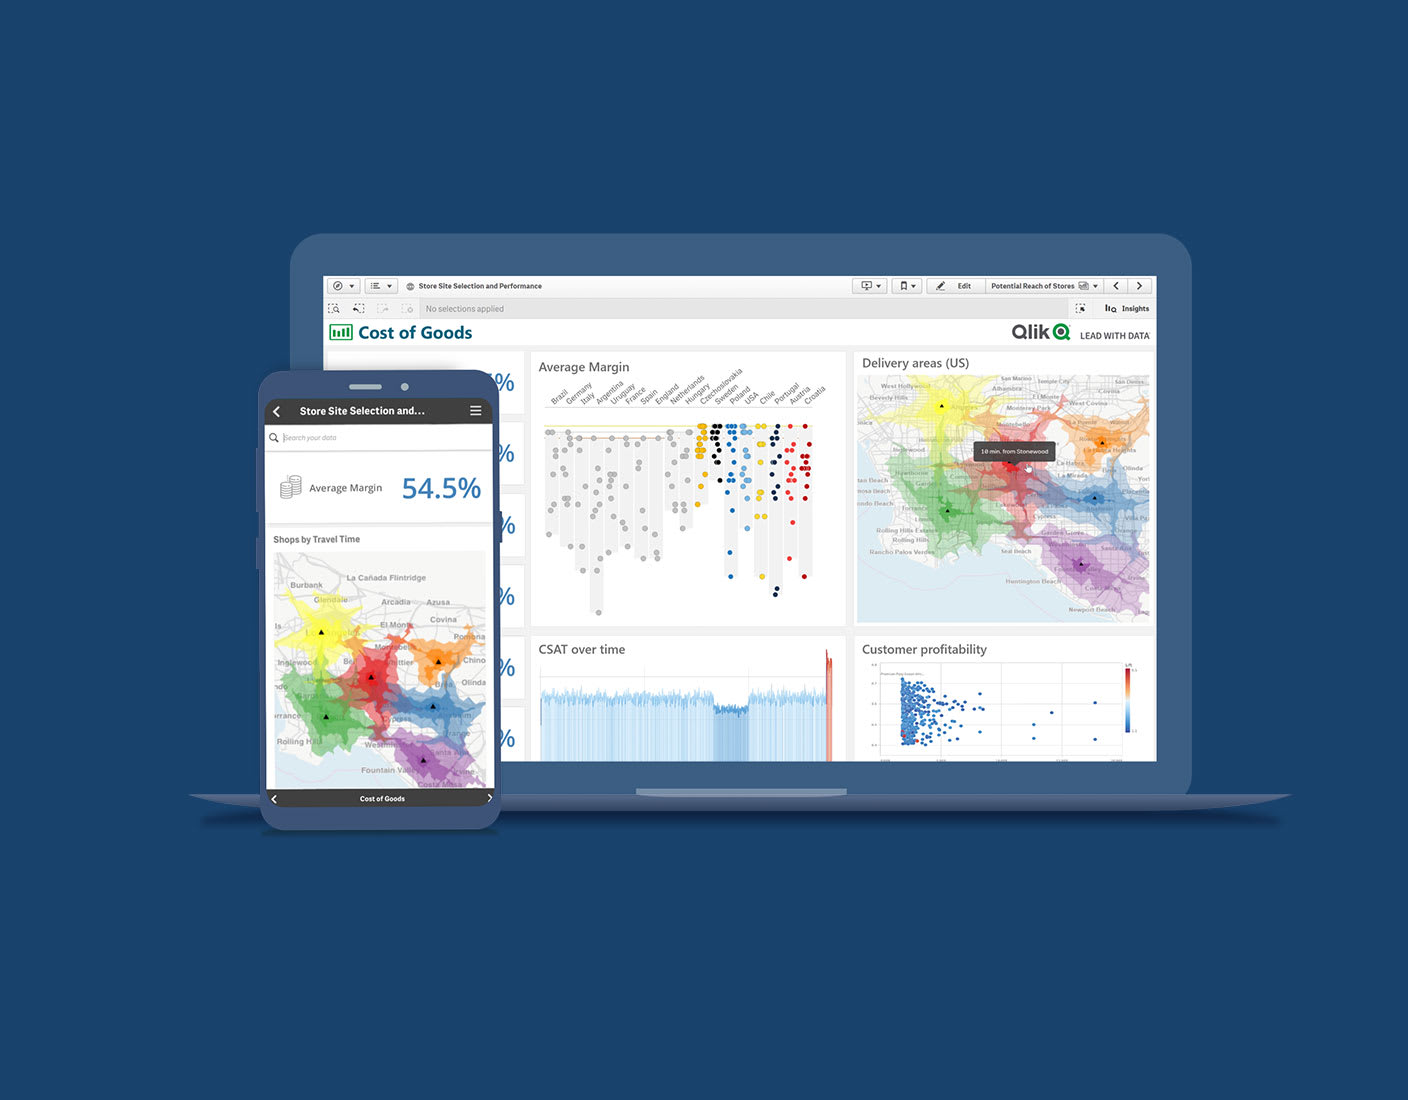
Get inspired by the top-performing dashboard examples and templates. Explore real, interactive dashboards for your industry or job role.| Qlik
Qlik, now with Talend, delivers a data fabric and next-level insights with its end-to-end data integration, data quality, & analytics solutions.| Qlik
Empower intelligent decisions with Qlik's data integration and quality solutions. Seamlessly integrate, transform, and ensure high-quality data for optimal insights.| Qlik
QlikView has been replaced with Qlik Cloud Analytics for a cloud-based SaaS deployment and Qlik Sense for an on-premises solution.| Qlik
Qlik Sense offers modern analytics that empowers users at all skill levels to uncover insights and trigger actions when it matters. Go beyond the dashboard.| Qlik
KPI stands for key performance indicator, which means a quantifiable measure of performance over time for a specific objective. Get examples & choose KPIs.| Qlik
