Why use a map? Imagine a map of your hometown. Seeing that a creek runs along main street or that there are connecting side streets running adjacent to that one highway with the notorious stoplight is the kind of spatial information that could meaningfully impact your life. Now imagine a map of a town you’ve... The post Brain Cartography: Mapping a place that everyone knows, but (almost) no one has ever been appeared first on Stamen.| Stamen
This summer I had the honor of speaking at DATA | ART, an event at MIT and sponsored by MetaLab at Harvard and Northeastern University, that gathers practitioners who live in the liminal space between “what is data” and “what becomes art.” The conversation often revolves around the tension between precision and poetry, between representation...| Stamen
that Stamen and Densho created to showcase daily life at the Manzanar internment camp in California. With this tool, most of the 10,000+ individuals imprisoned at Manzanar are mapped at the apartment level. You can see how the population changes over time, view different demographic information about individuals, read biweekly newspapers written by prisoners, and find specific people by name.| Stamen
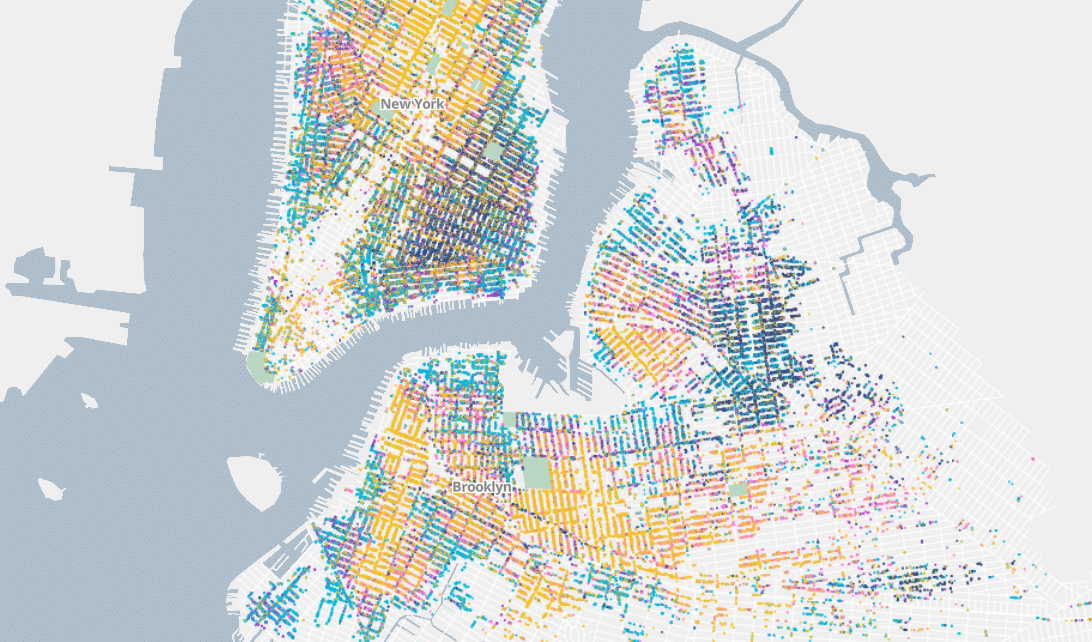
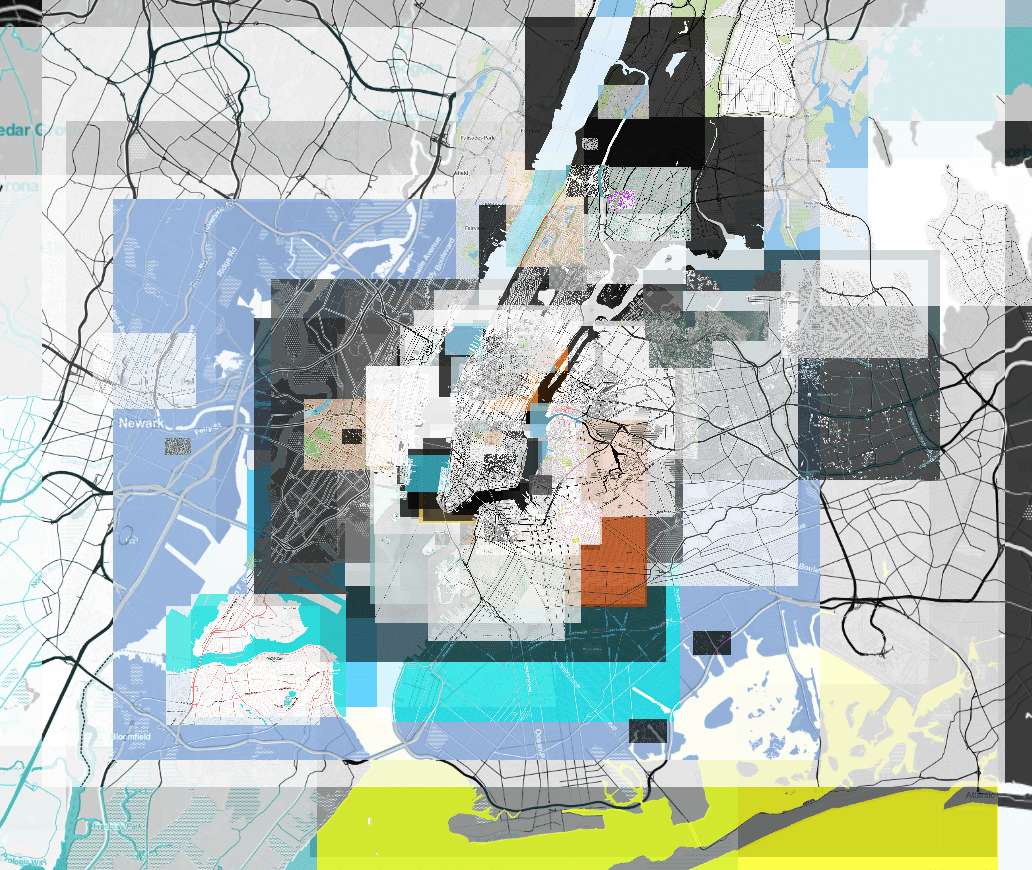
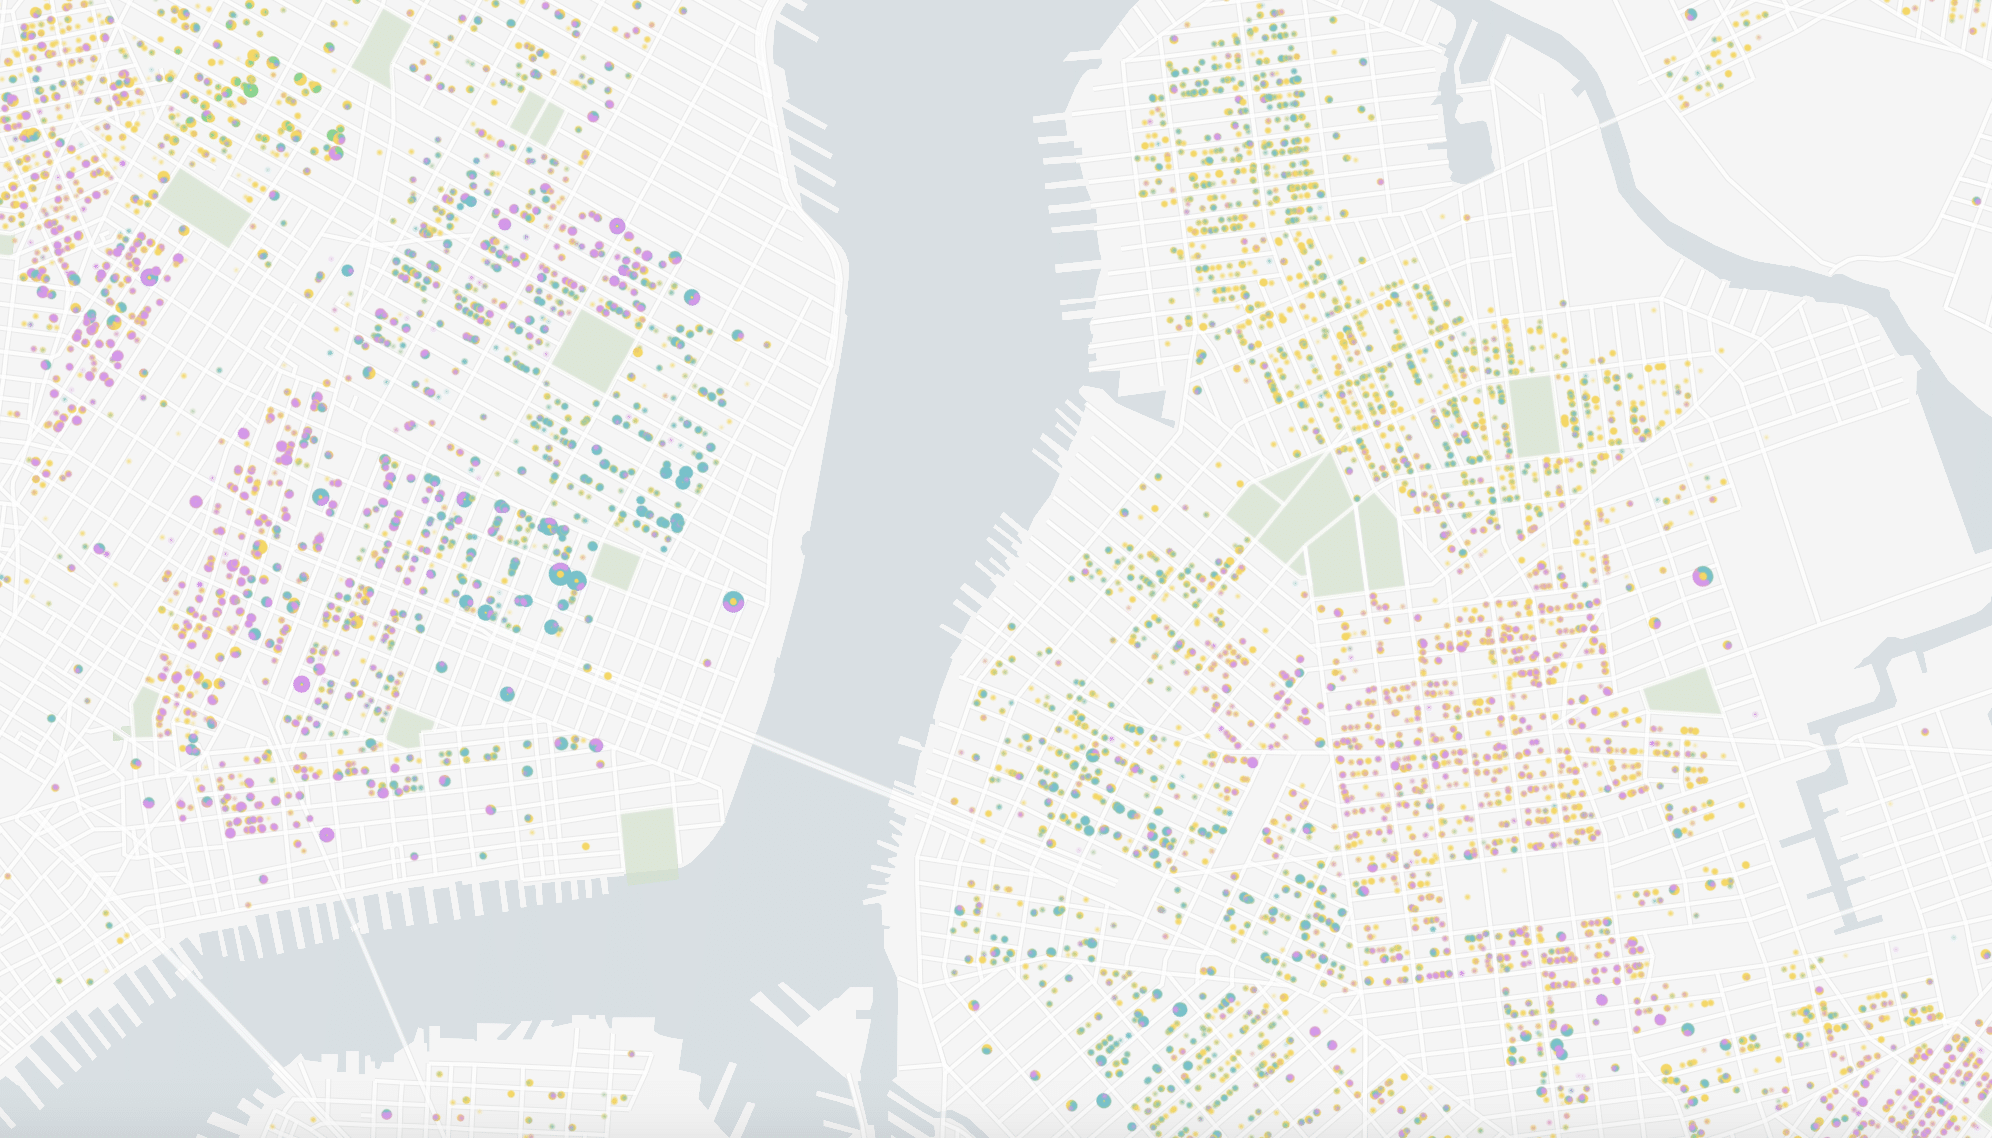
In 2021 Stamen had the pleasure of working on Mapping Historical New York with Columbia University’s Center for Spatial Research. The Center came to the table with a large and unique dataset of historical census data for the areas that are now Manhattan and Brooklyn dating back to 1850. Part of what is special about...| Stamen
Last month, I led an interactive workshop at The Midwest Climate Adaptation Science Center’s Summer Symposium at the University of Illinois Urbana-Champaign in Urbana, Illinois. MW CASC is a consortium of research-focused academic, Tribal, and non-profit partners working collaboratively with the United States Geological Survey (USGS). The workshop focused on data visualization and mapping for... The post Data visualization and mapping for a scientific audience with USGS Midwest Climate Ad...| Stamen
More than 20 years of building impactful, award-winning visualizations and custom data viz tools. Recipient of National Interaction Design Award from the Smithsonian.| Stamen
Earlier this summer, Stamen collaborated with the team at MetroMatch to update the look and feel of their transit-first navigation tool. MetroMatch is a transit-focused travel planning and discovery site that connects travelers to destinations that are only a short walk from rail stations. MetroMatch’s pilot focuses on Washington, DC, taking advantage of the region’s...| Stamen
A personal history of OpenStreetMap, seen through the eyes of Stamen Design by Alan McConchie and the Stamen Design team Recap Back in 2021, we wrote a two-part blog post about the history of Stamen Design and OpenStreetMap (“OSM” for short), and the twists and turns of Stamen’s close relationship with the OSM project over...| Stamen
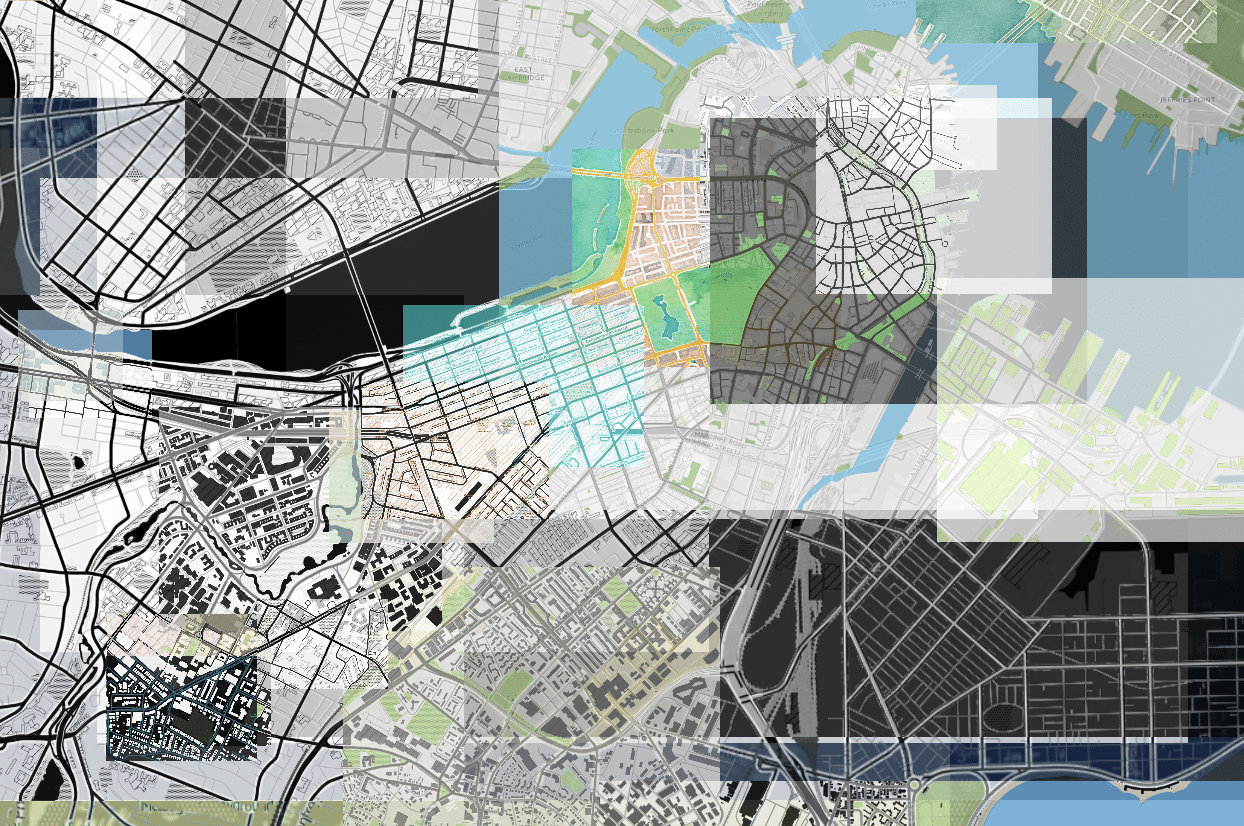
The State of the Map US (SOTMUS) 2025 conference in Boston, MA was yet another fantastic gathering of cartographers, mappers, and map enthusiasts. Stamen was well-represented this year by Kelsey Taylor, Eric Brelsford, and Eric Rodenbeck. We presented two talks on Stamen projects related to open source tooling with maps. Now that we’re back in...| Stamen
Stamen is officially retiring Map Stack, a platform we previously hosted that gave everyone a straightforward way to mix and modify raster base maps. What was Map Stack? Created in 2013, Map Stack gave you an interface where you could select from a variety of raster base maps, tweak the images that made up the...| Stamen
In vector cartography, the map is only as good as the data that powers it. If we don’t understand what’s going on in the underlying data, we’re pretty limited in our cartographic approach. A major part of this work involves parsing vector tile data, determining how one dataset compares to another, and diagnosing bugs encountered...| Stamen
What is the Connection Engine? The Congruence Engine (later renamed Connection Engine) is a three-year research project funded by the Arts and Humanities Research Council in efforts to digitally connect industrial heritage collections across the UK. Using advanced digital tools such as AI, it links museum objects, archives, photographs, and more, enabling historians and curators...| Stamen
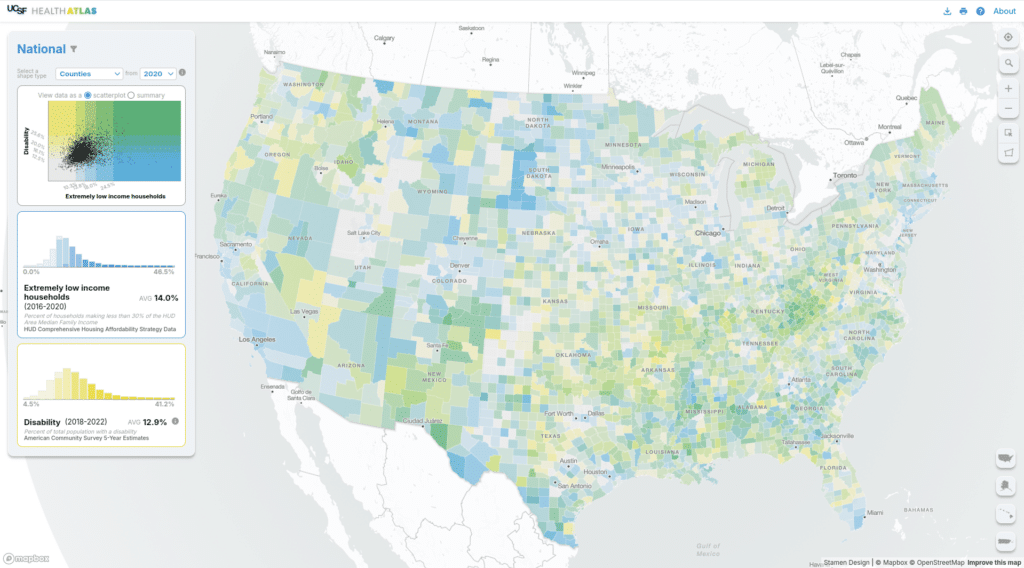
Stamen has been working with a team out of UCSF (University of San Francisco) Population Health and Health Equity to create and maintain their Health Atlas since 2019. You can read a bit about the initial launch in our blog post from 2020. In 2024 we had the opportunity to rebuild the Health Atlas and...| Stamen
Content in this post comes from our presentation at the North American Cartographic Information Society (NACIS) 2024 Annual Meeting last week in Tacoma, WA. Mapping Historical New York: A Digital Atlas visualizes New York City’s transformations during the late-nineteenth and early-twentieth centuries both in terms of population and landscape. Drawing on 1850, 1880, 1910, and...| Stamen