Grafana Alloy | Grafana Alloy documentation
Grafana Alloy is a vendor-neutral distribution of the OTel Collector| Grafana Labs
Grafana Alloy is a vendor-neutral distribution of the OTel Collector| Grafana Labs
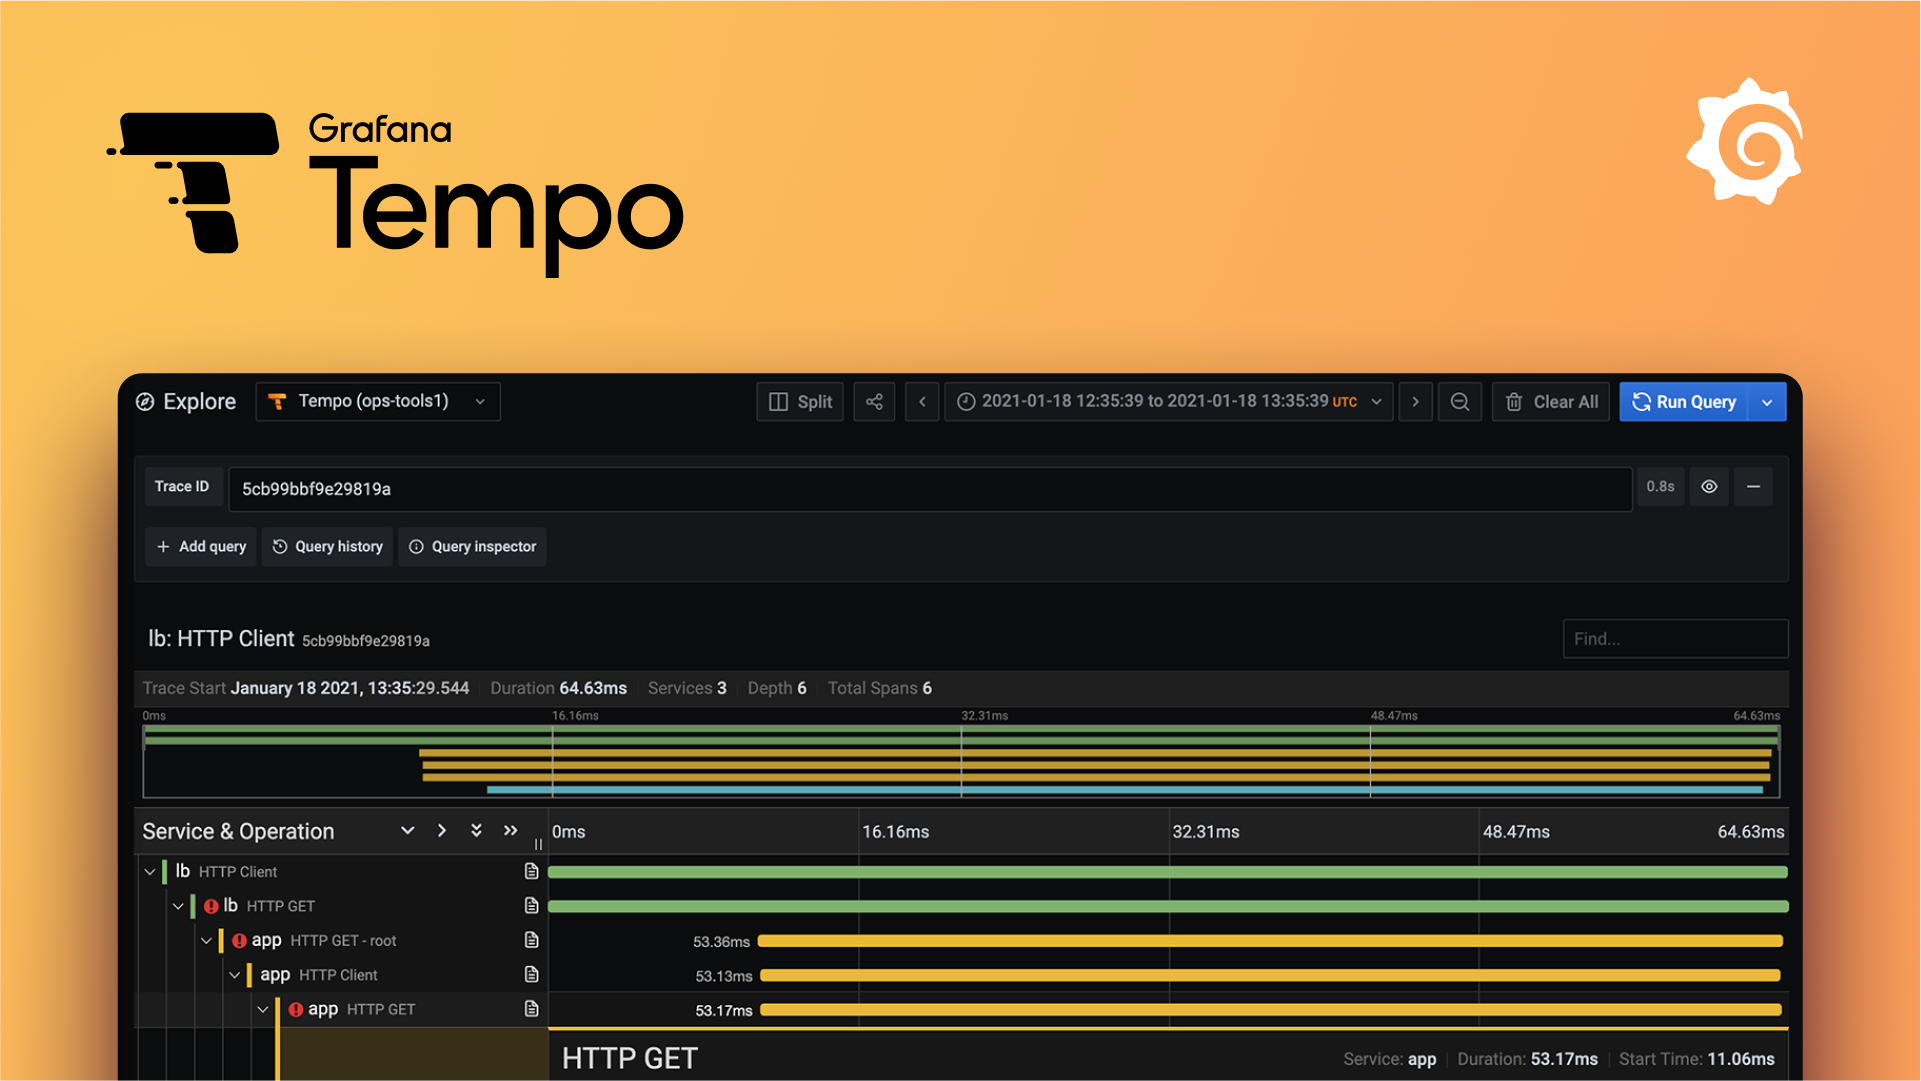
Grafana Tempo is an open source, easy-to-use, and high-scale distributed tracing backend.| Grafana Labs
Guide for using Loki in Grafana| Grafana Labs
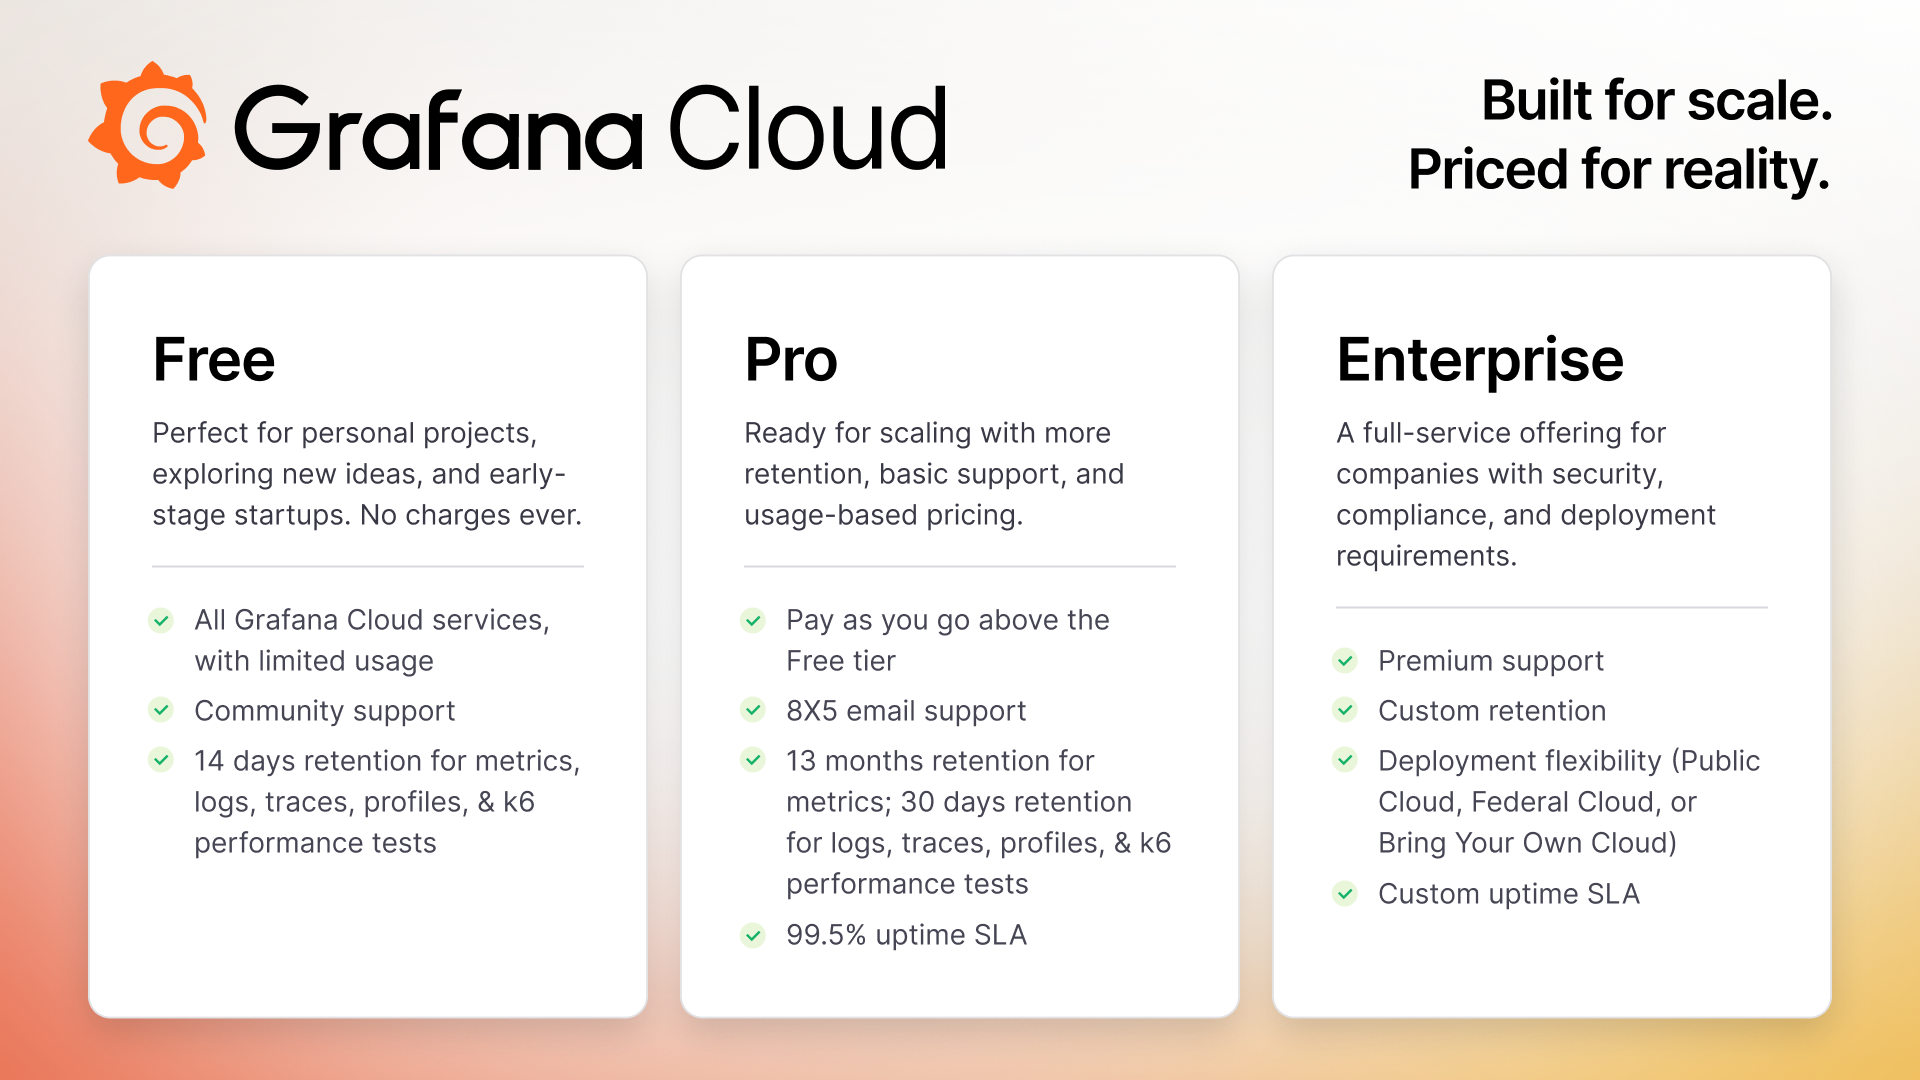
Welcome to Grafana Cloud| grafana.com

In celebration of The Life of a Showgirl, a team of Grafanistas used Grafana Assistant to build a dazzling dashboard that lets you visualize the eras and career milestones of the one and only Taylor Swift.| Grafana Labs
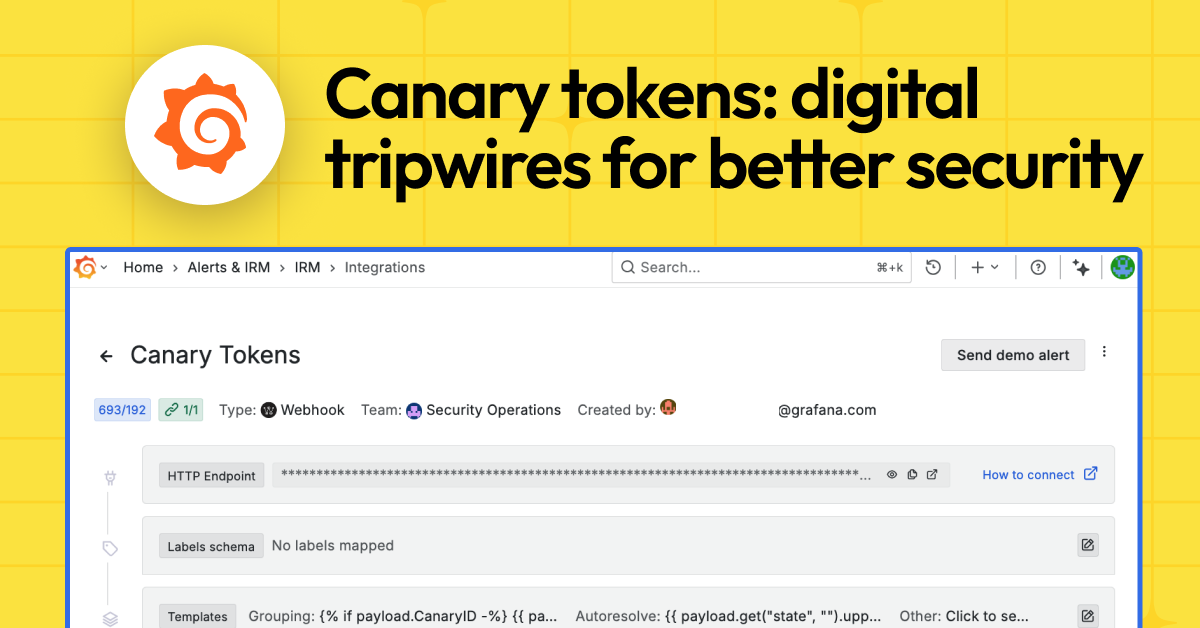
Learn why the use of canary tokens let us spot a recent intrusion and swarm quickly in response, and find out why you should be using canary tokens to prevent serious security incidents in the future.| Grafana Labs

Altinity Grafana datasource for ClickHouse| Grafana Labs

Catch up on all the latest news out of GrafanaCON 2025, including the release of Grafana 12 and Grafana k6 1.0.| Grafana Labs
At Grafana Labs, Hackathons are a core part of our culture — but these events, and the projects that emerge from them, also heavily influence our roadmap.| Grafana Labs

Tempo is designed to be a robust trace id lookup store whose only dependency is object storage (GCS/S3).| Grafana Labs

With our new integrated AI agent you can write in natural language to ask observability questions, see certain data, build dashboards, and make changes—all without leaving the Grafana UI.| Grafana Labs
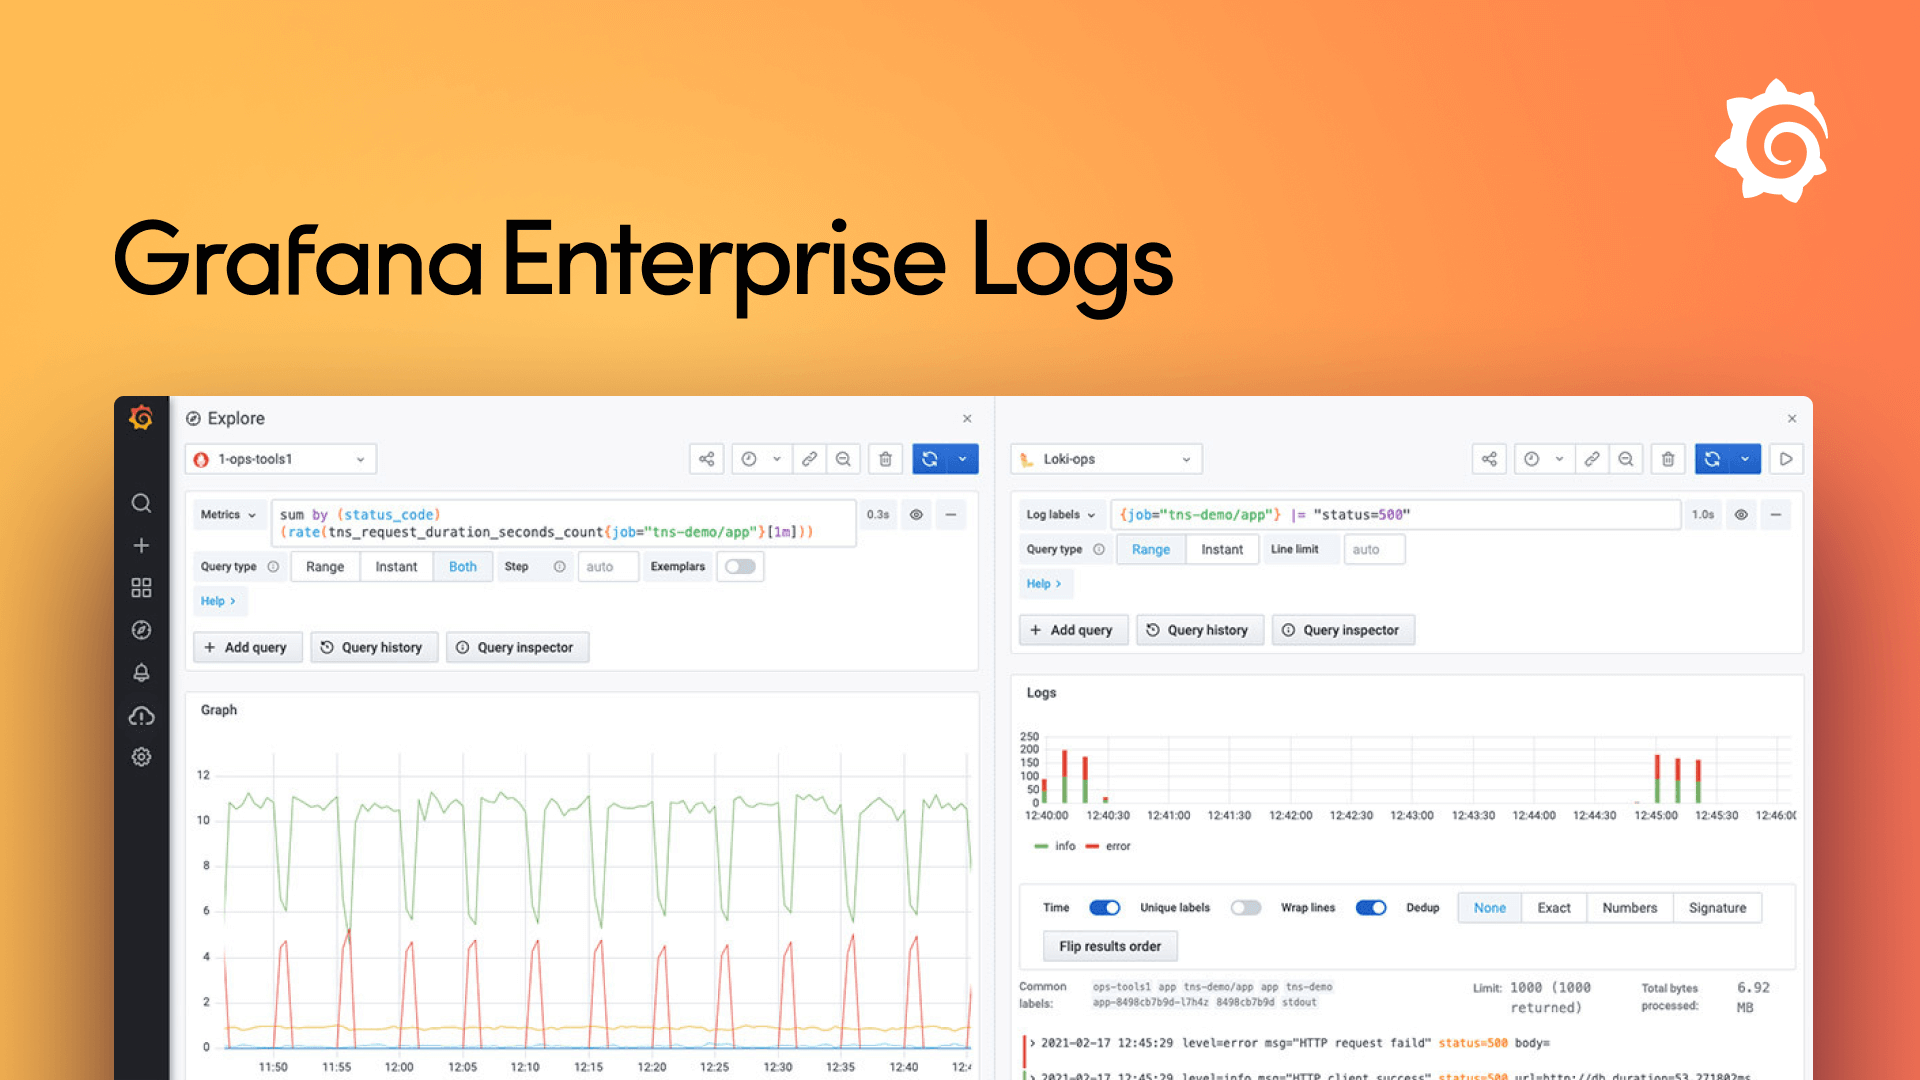
Grafana Enterprise Logs offers a unique approach to log indexing, storage and administration control that runs securely at scale and is supported by Grafana.| Grafana Labs
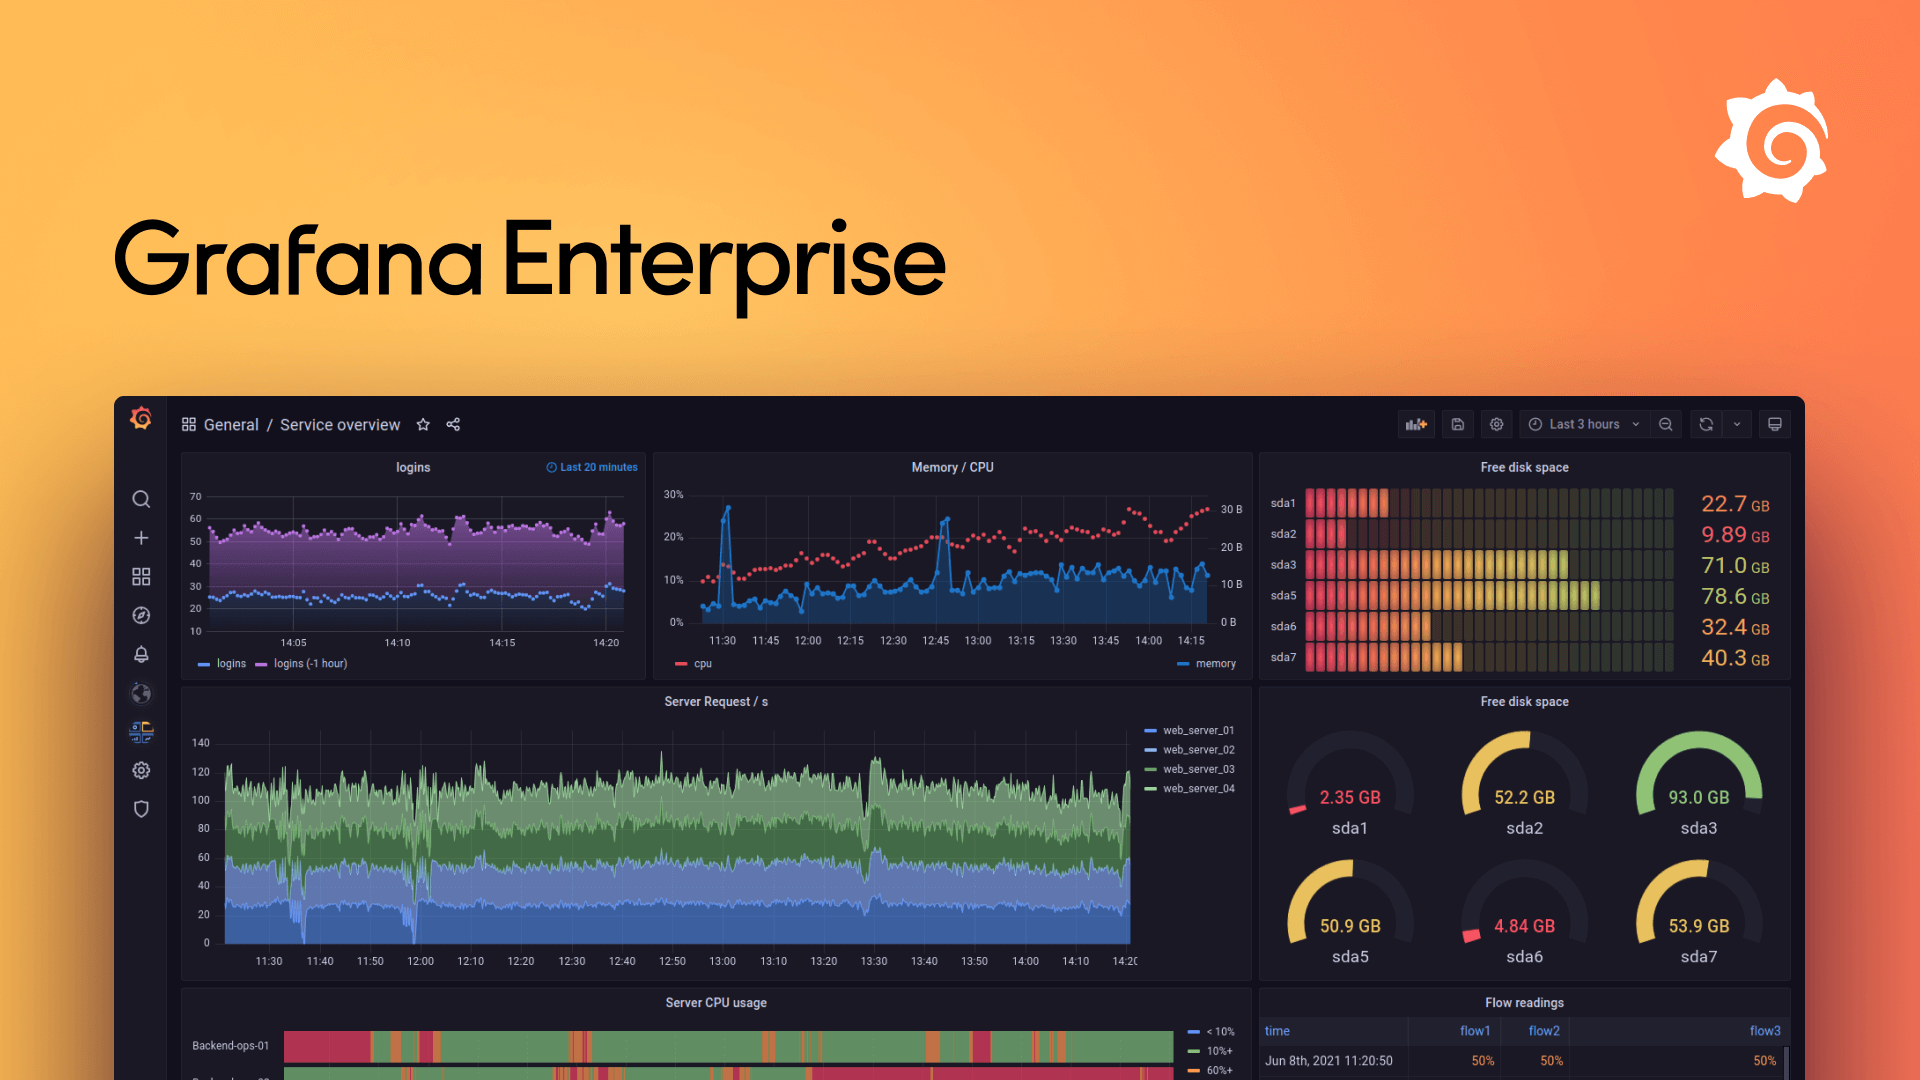
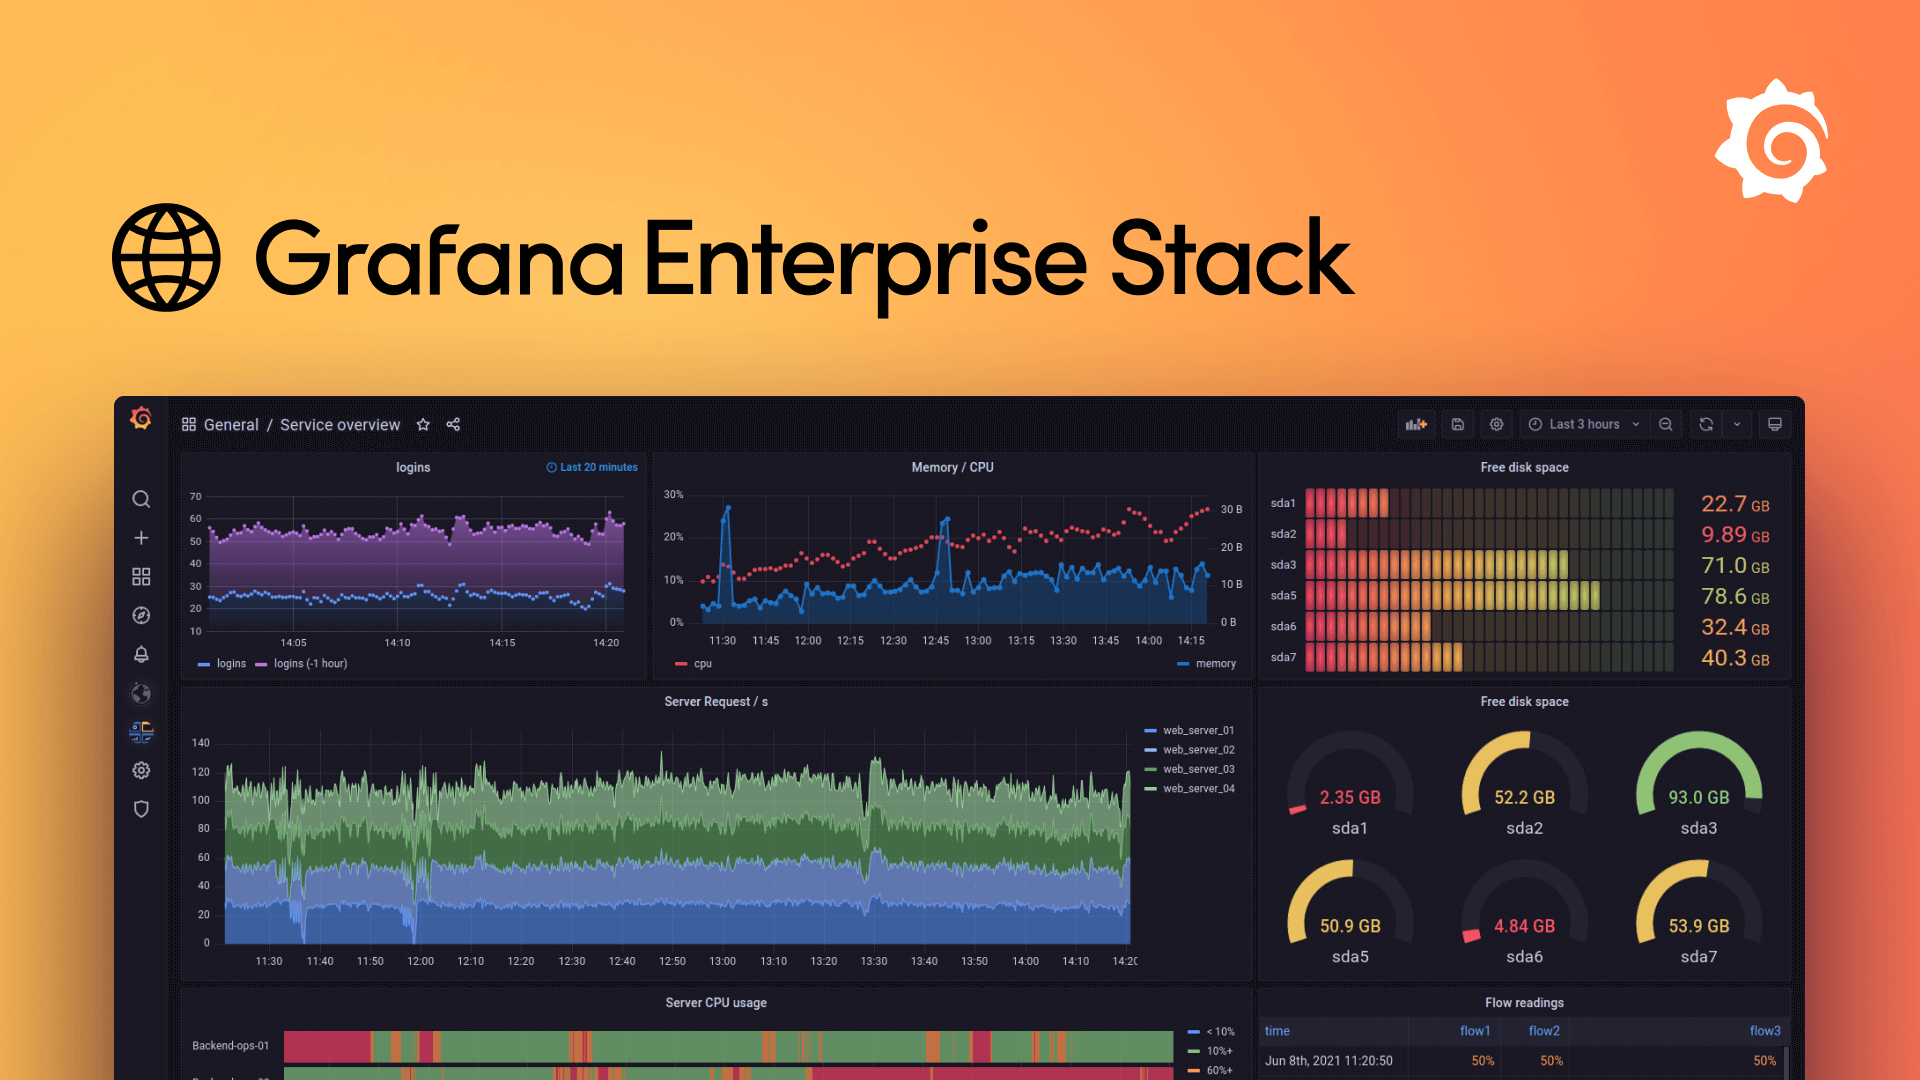
Why organizations choose Grafana Enterprise: Enhanced collaboration and usage analytics for teams. Advanced security and reporting requirements. Visibility into your full stack with Enterprise plugins like Splunk, ServiceNow, Datadog, and more. Ability to scale complex architectures and deploy faster. Access to talented experts on Prometheus, Graphite, and Grafana.| Grafana Labs
With the addition of GET, Grafana Labs’ self-managed stack now brings together the pillars of observability — metrics, logs, and traces — for enterprise scale.| Grafana Labs
Want to understand how much Grafana costs? Learn about pricing for Grafana, Prometheus / Mimir (Metrics), Loki (Logs), Tempo (Traces), and more.| Grafana Labs
Find answers to your technical questions and learn how to use Grafana OSS and Enterprise products.| Grafana Labs
Grafana Loki is a set of open source components that can be composed into a fully featured logging stack.| Grafana Labs
Grafana is an open source visualization and dashboarding technology that allows you to explore your metrics, logs, and traces no matter where the data is.| Grafana Labs

Mat Ryer, principal engineer at Grafana Labs and host of the Go Time podcast, shares what he's learned from more than a dozen years of writing HTTP services in Go.| Grafana Labs
Learn about the key benefits and features of Grafana Alerting| Grafana Labs

Grafana Faro is an open source tool for monitoring web application performance, discovering frontend errors, and performing real user monitoring (RUM).| Grafana Labs
News, announcements, articles, metrics & monitoring love...| Grafana Labs
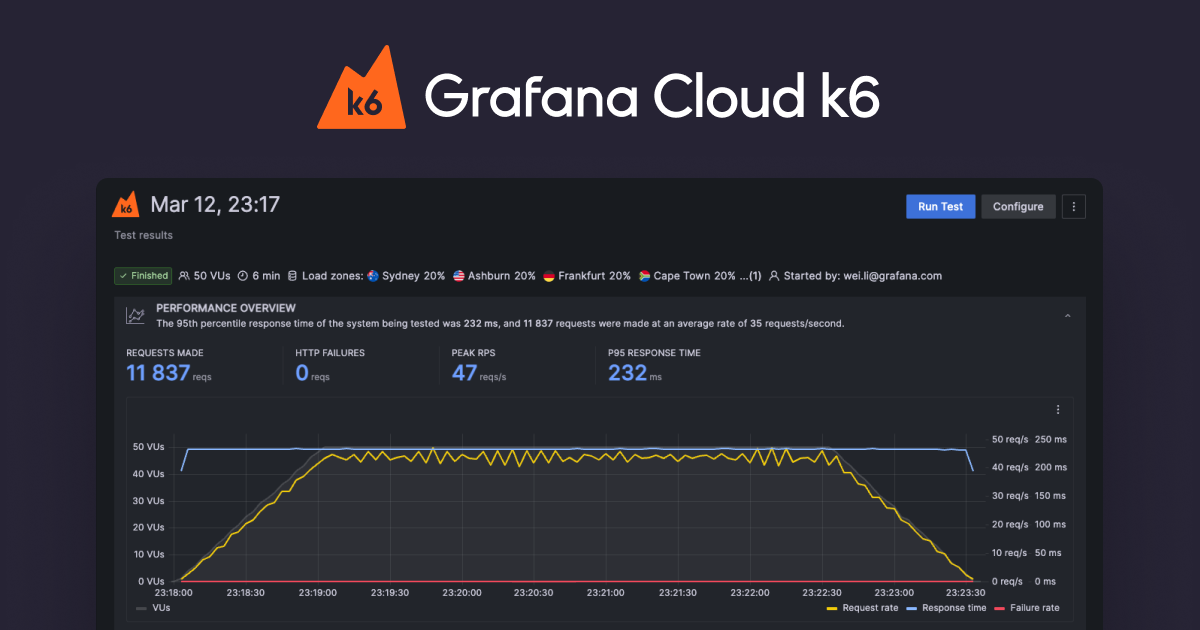
With Grafana Cloud k6, you can easily run cloud-based performance tests for up to 1 million concurrent virtual users or 5 million requests/second.| Grafana Labs

Prometheus is the de facto monitoring system for Kubernetes and cloud native.| Grafana Labs
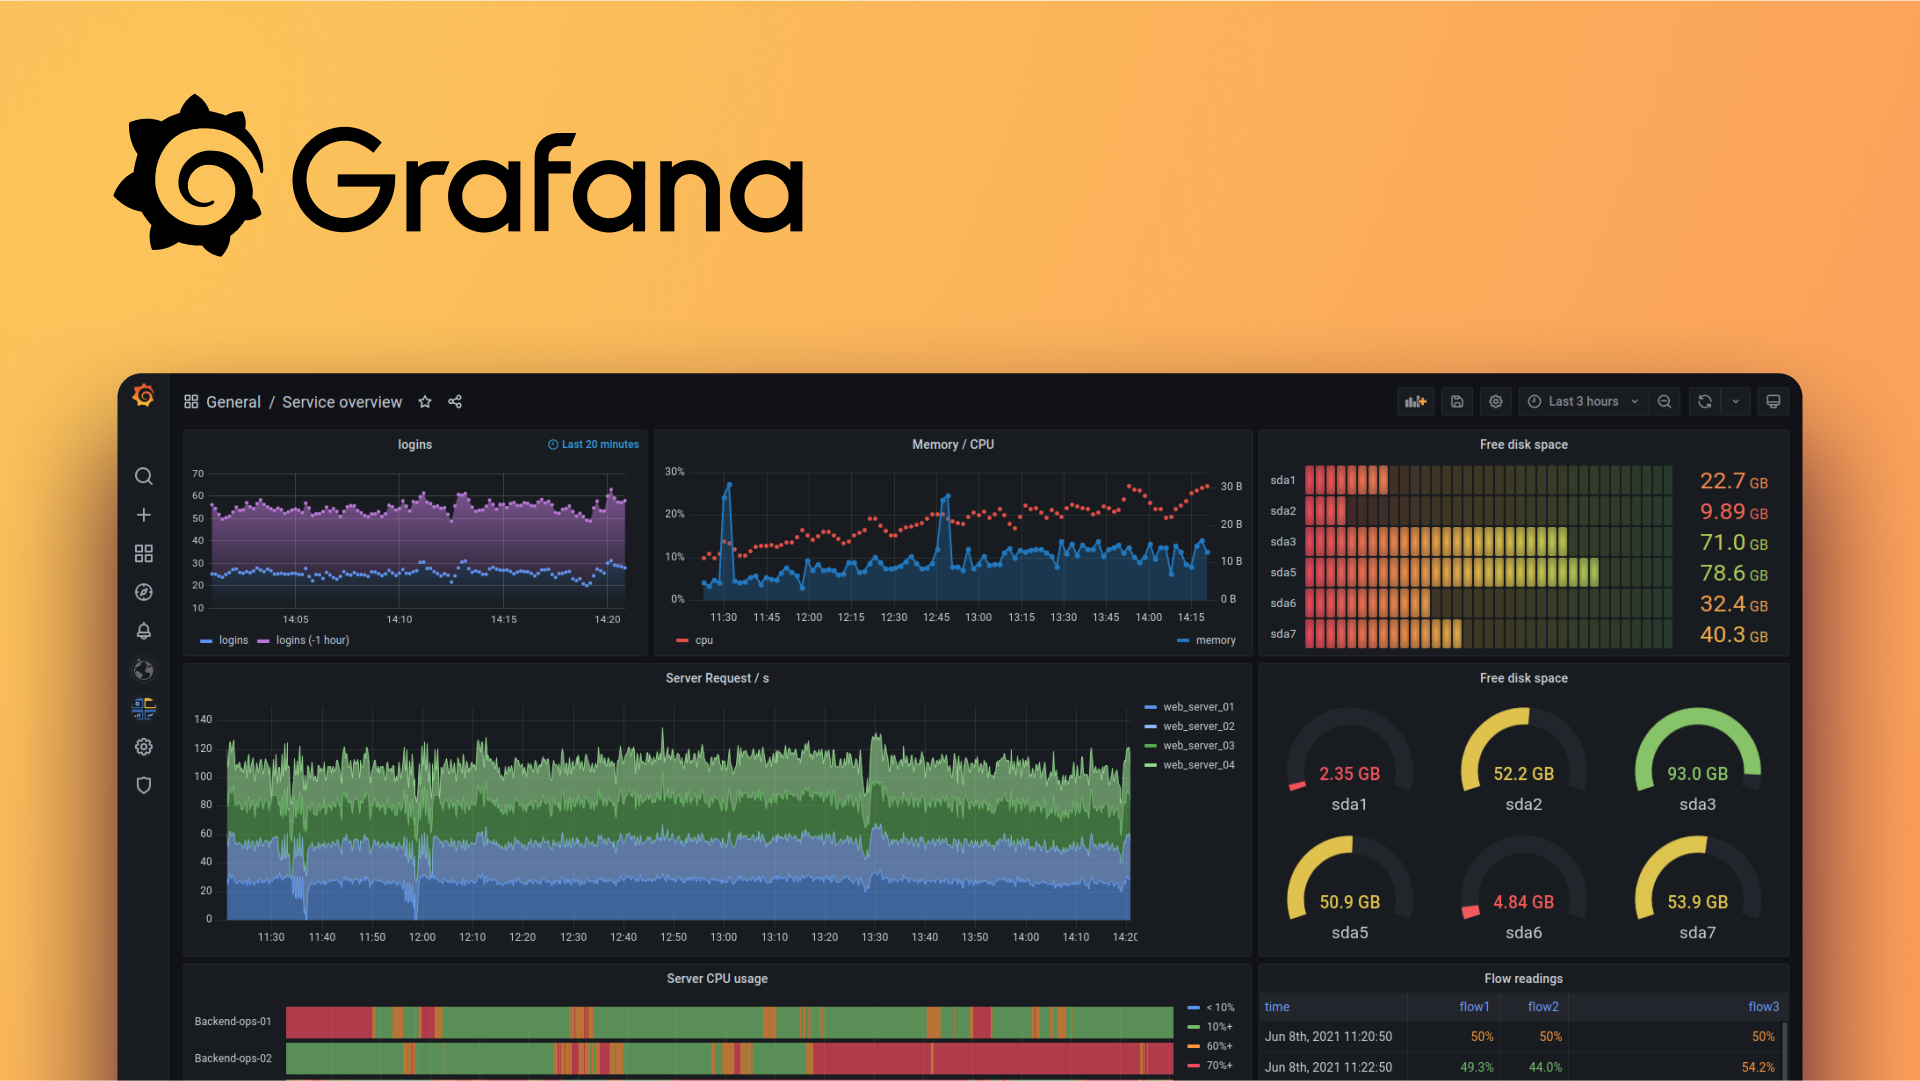
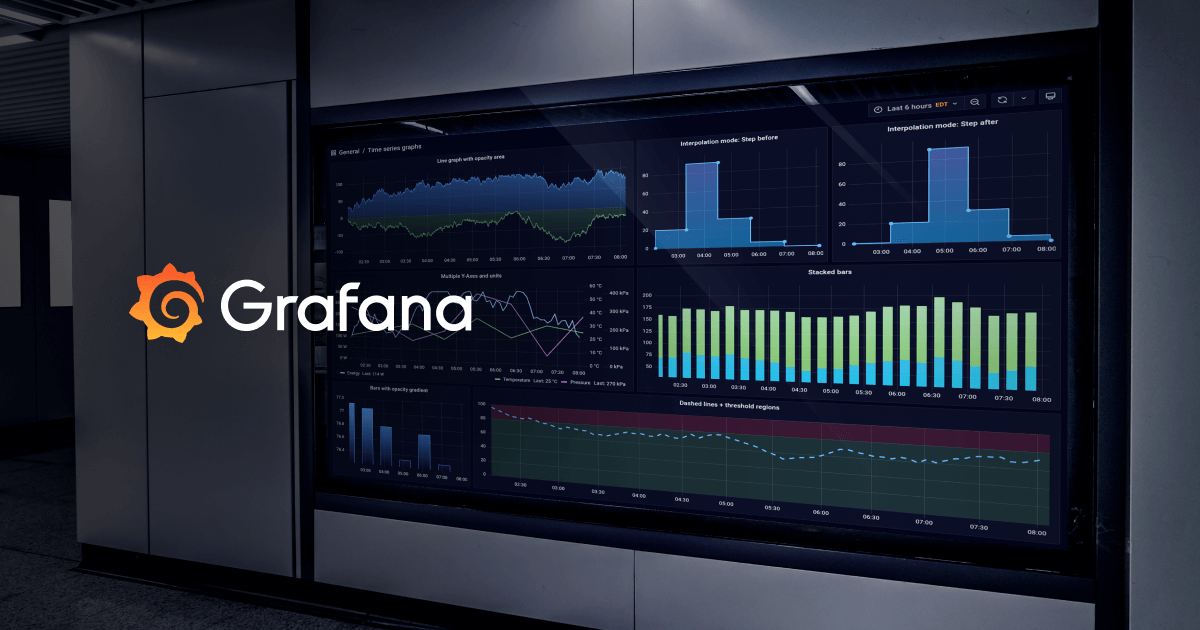
Improve operational efficiency, monitor your infrastructure, and analyze metrics, logs, and traces with Grafana, the leading open source tool for dashboards and visualizations.| Grafana Labs
Grafana Agent is a flexible, performant, vendor-neutral, telemetry collector| Grafana Labs
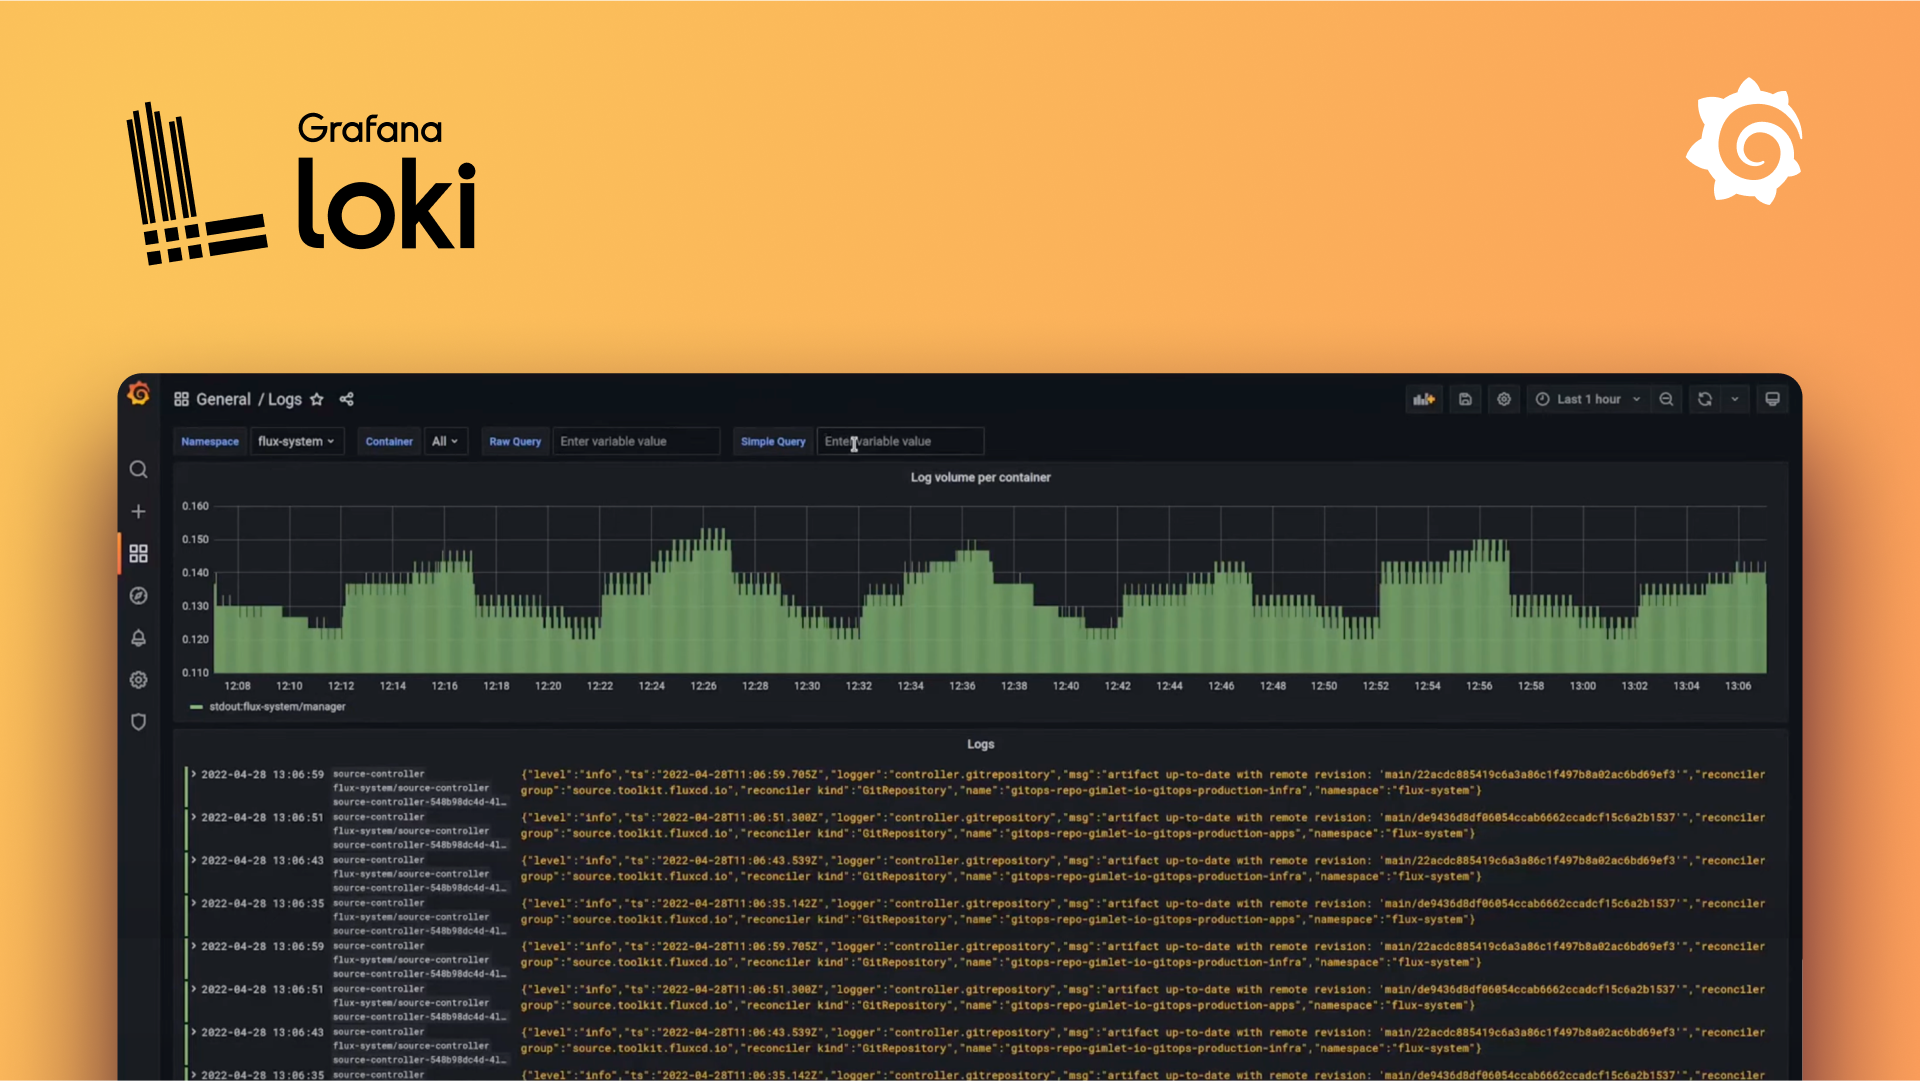
Loki is a horizontally scalable, highly available, multi-tenant log aggregation system inspired by Prometheus.| Grafana Labs
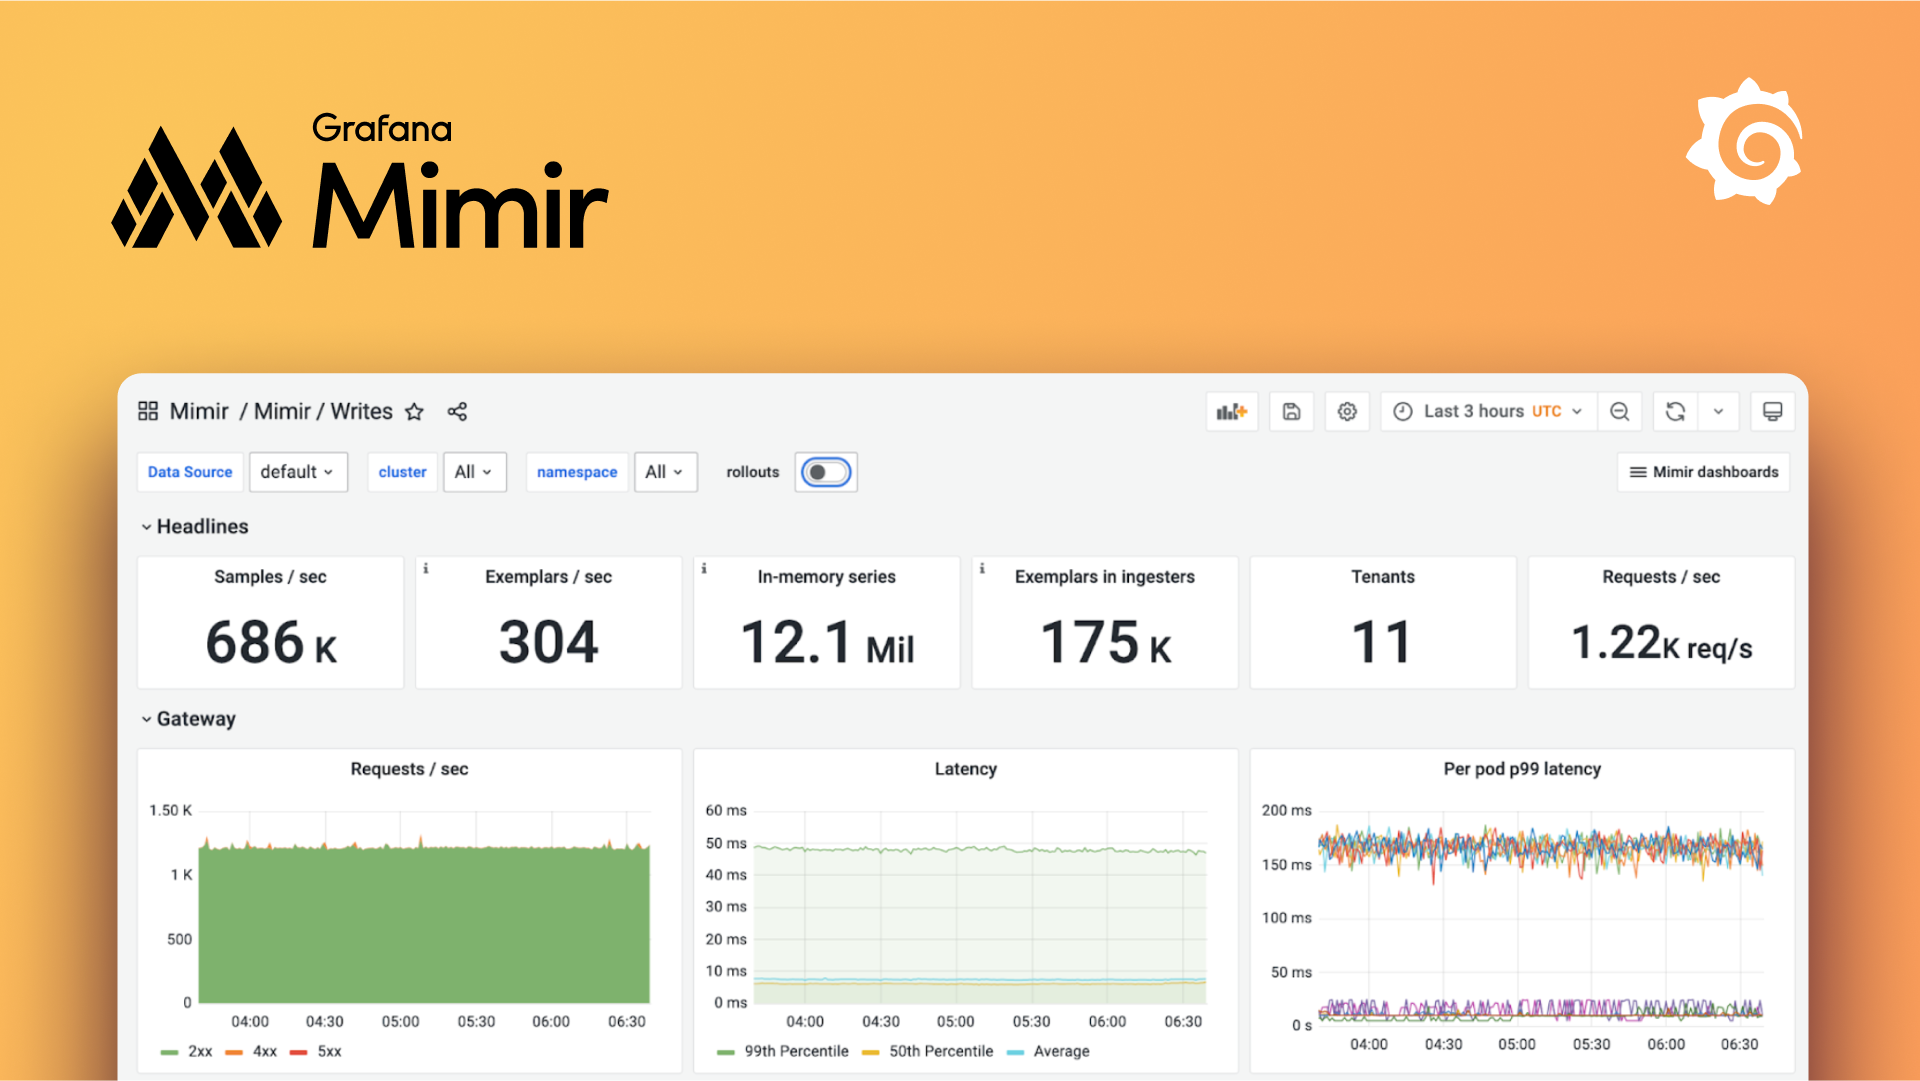
Mimir is an open source, horizontally scalable, highly available multi-tenant, long-term storage for Prometheus metrics.| Grafana Labs
Guide for deploying Grafana on Kubernetes| Grafana Labs
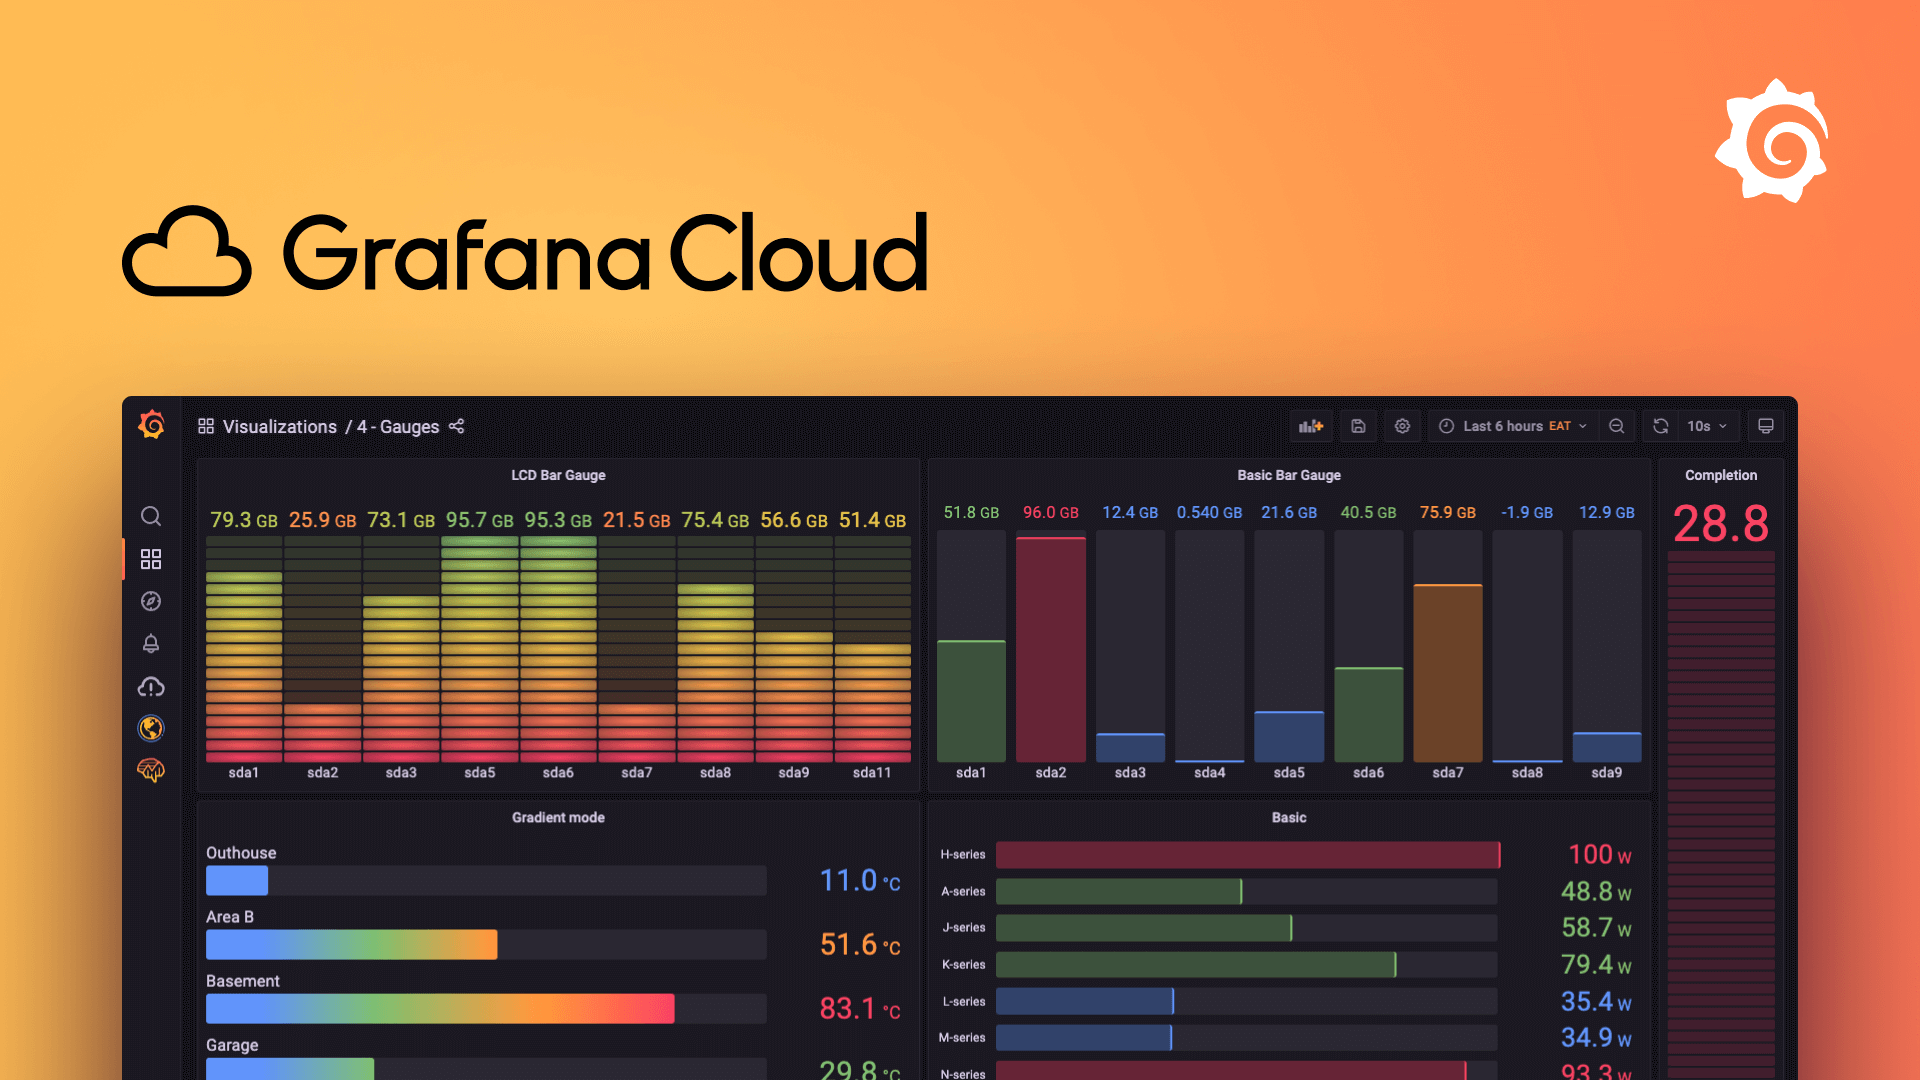
Fully managed cloud observability platform built on the open source projects Grafana, Mimir, Loki, and Tempo. Start your free trial.| Grafana Labs
Grafana feature overview, screenshots, videos, and feature tours.| Grafana Labs