
Morphocode Explorer - MORPHOCODE
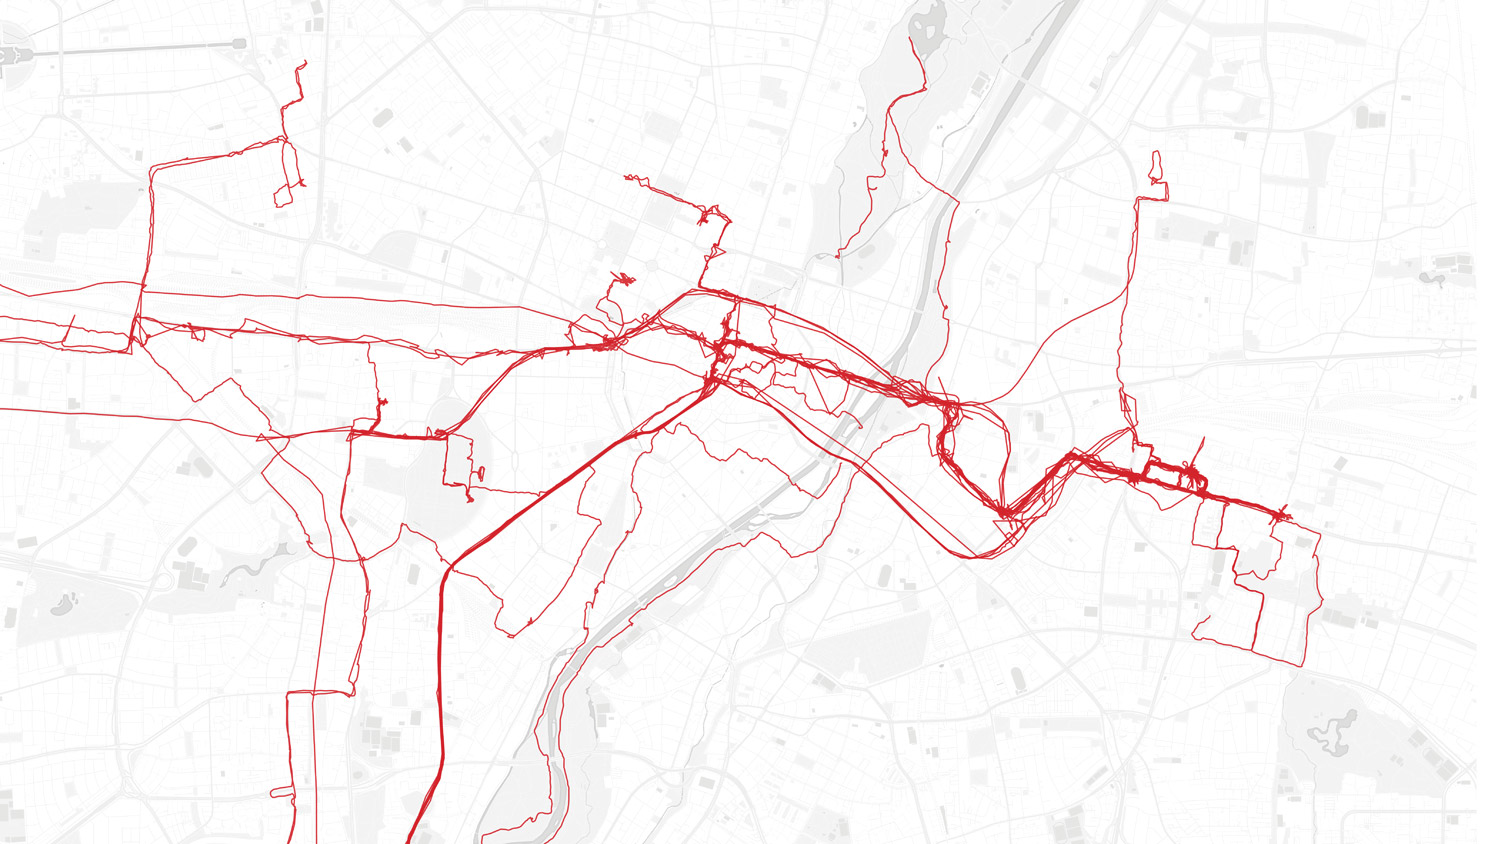
Morphocode Explorer lets you evaluate existing conditions and compare thematic maps on land use, development intensity, transit network, demographics, and urban morphology.| MORPHOCODE
Morphocode Explorer lets you evaluate existing conditions and compare thematic maps on land use, development intensity, transit network, demographics, and urban morphology.| MORPHOCODE

Interactive tools augment our problem-solving capacity. We rely on them to expand our minds and provide ease, accuracy, and speed in our daily tasks.| MORPHOCODE
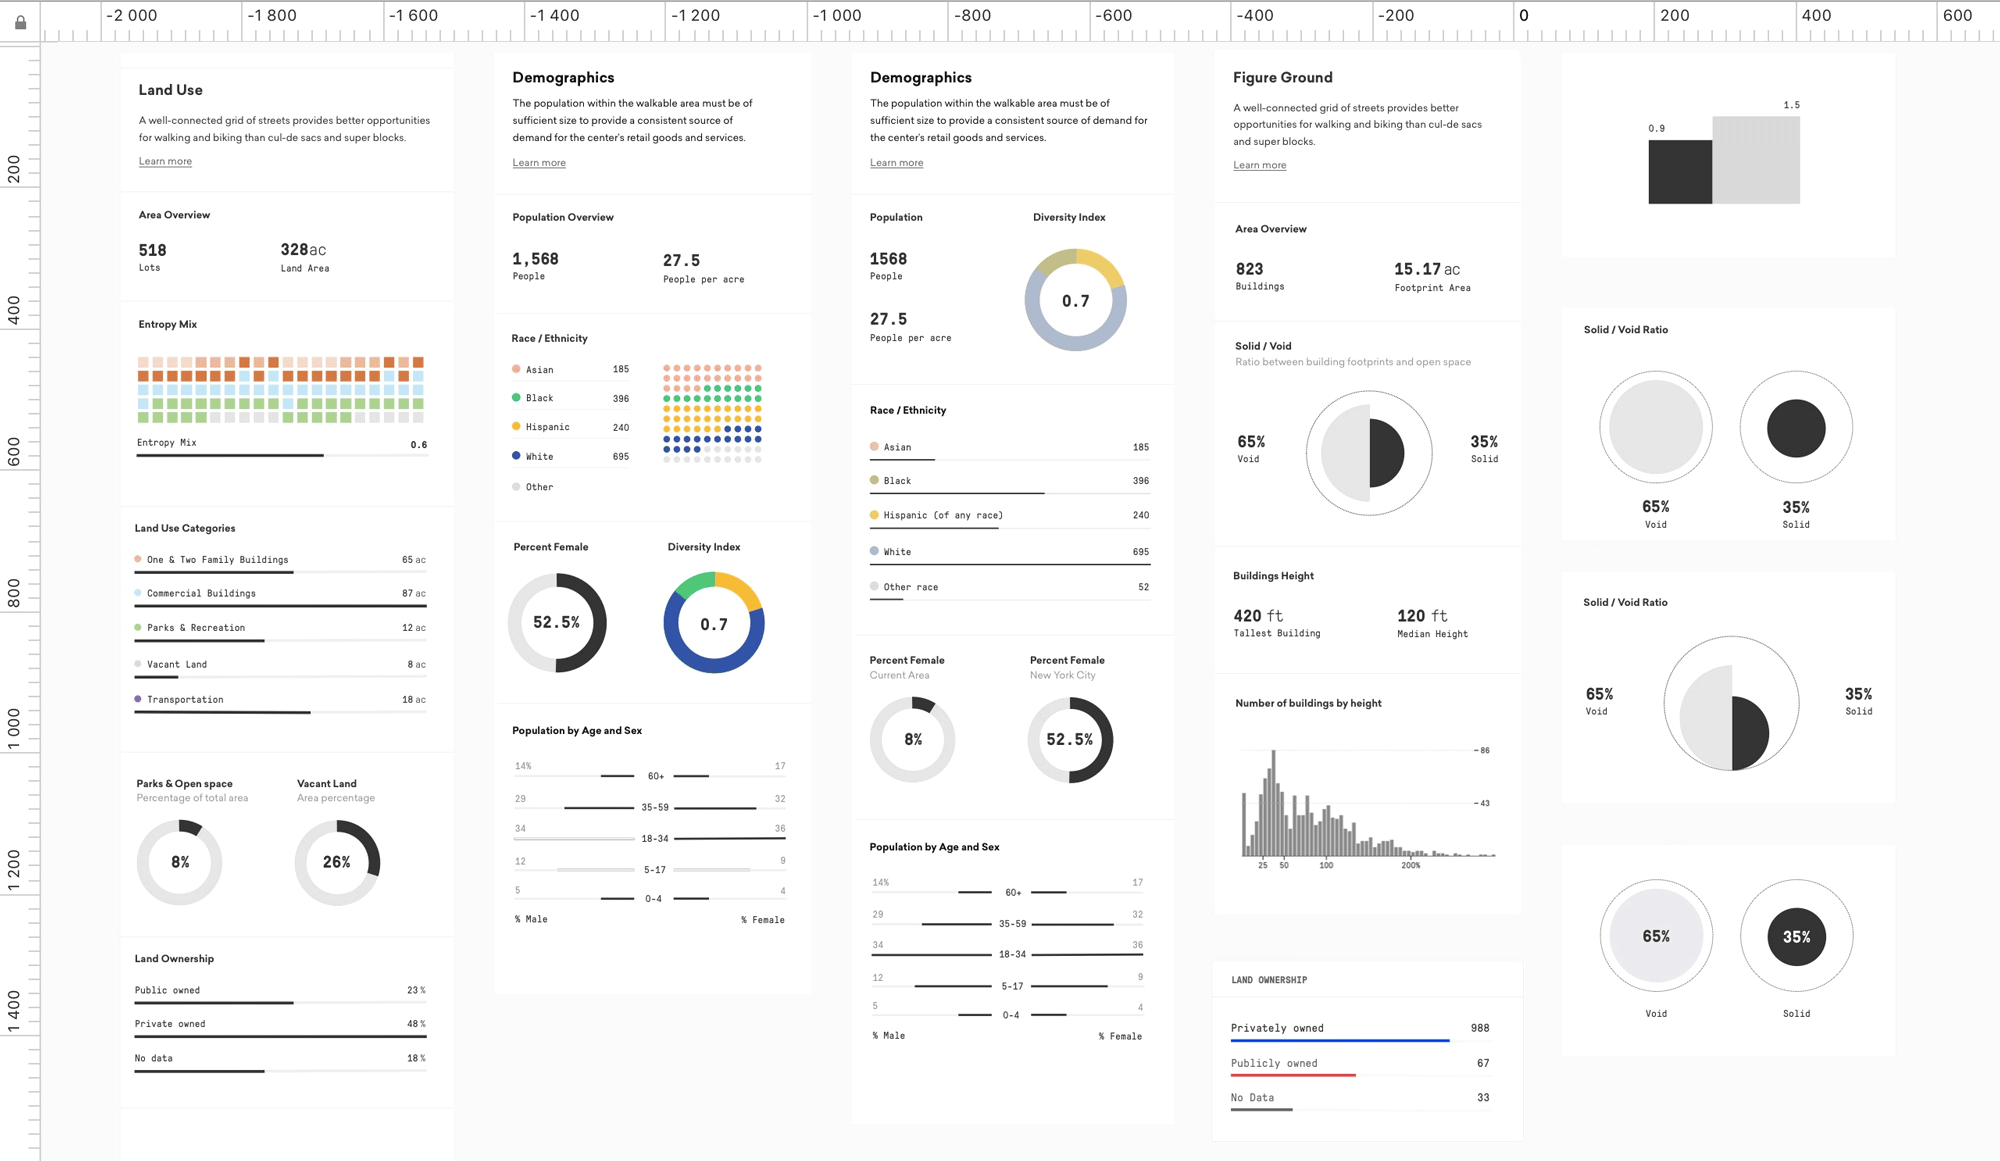
Morphocode Explorer is an interactive web tool for urban data analysis. It allows you to perform spatial research directly in the browser.| MORPHOCODE
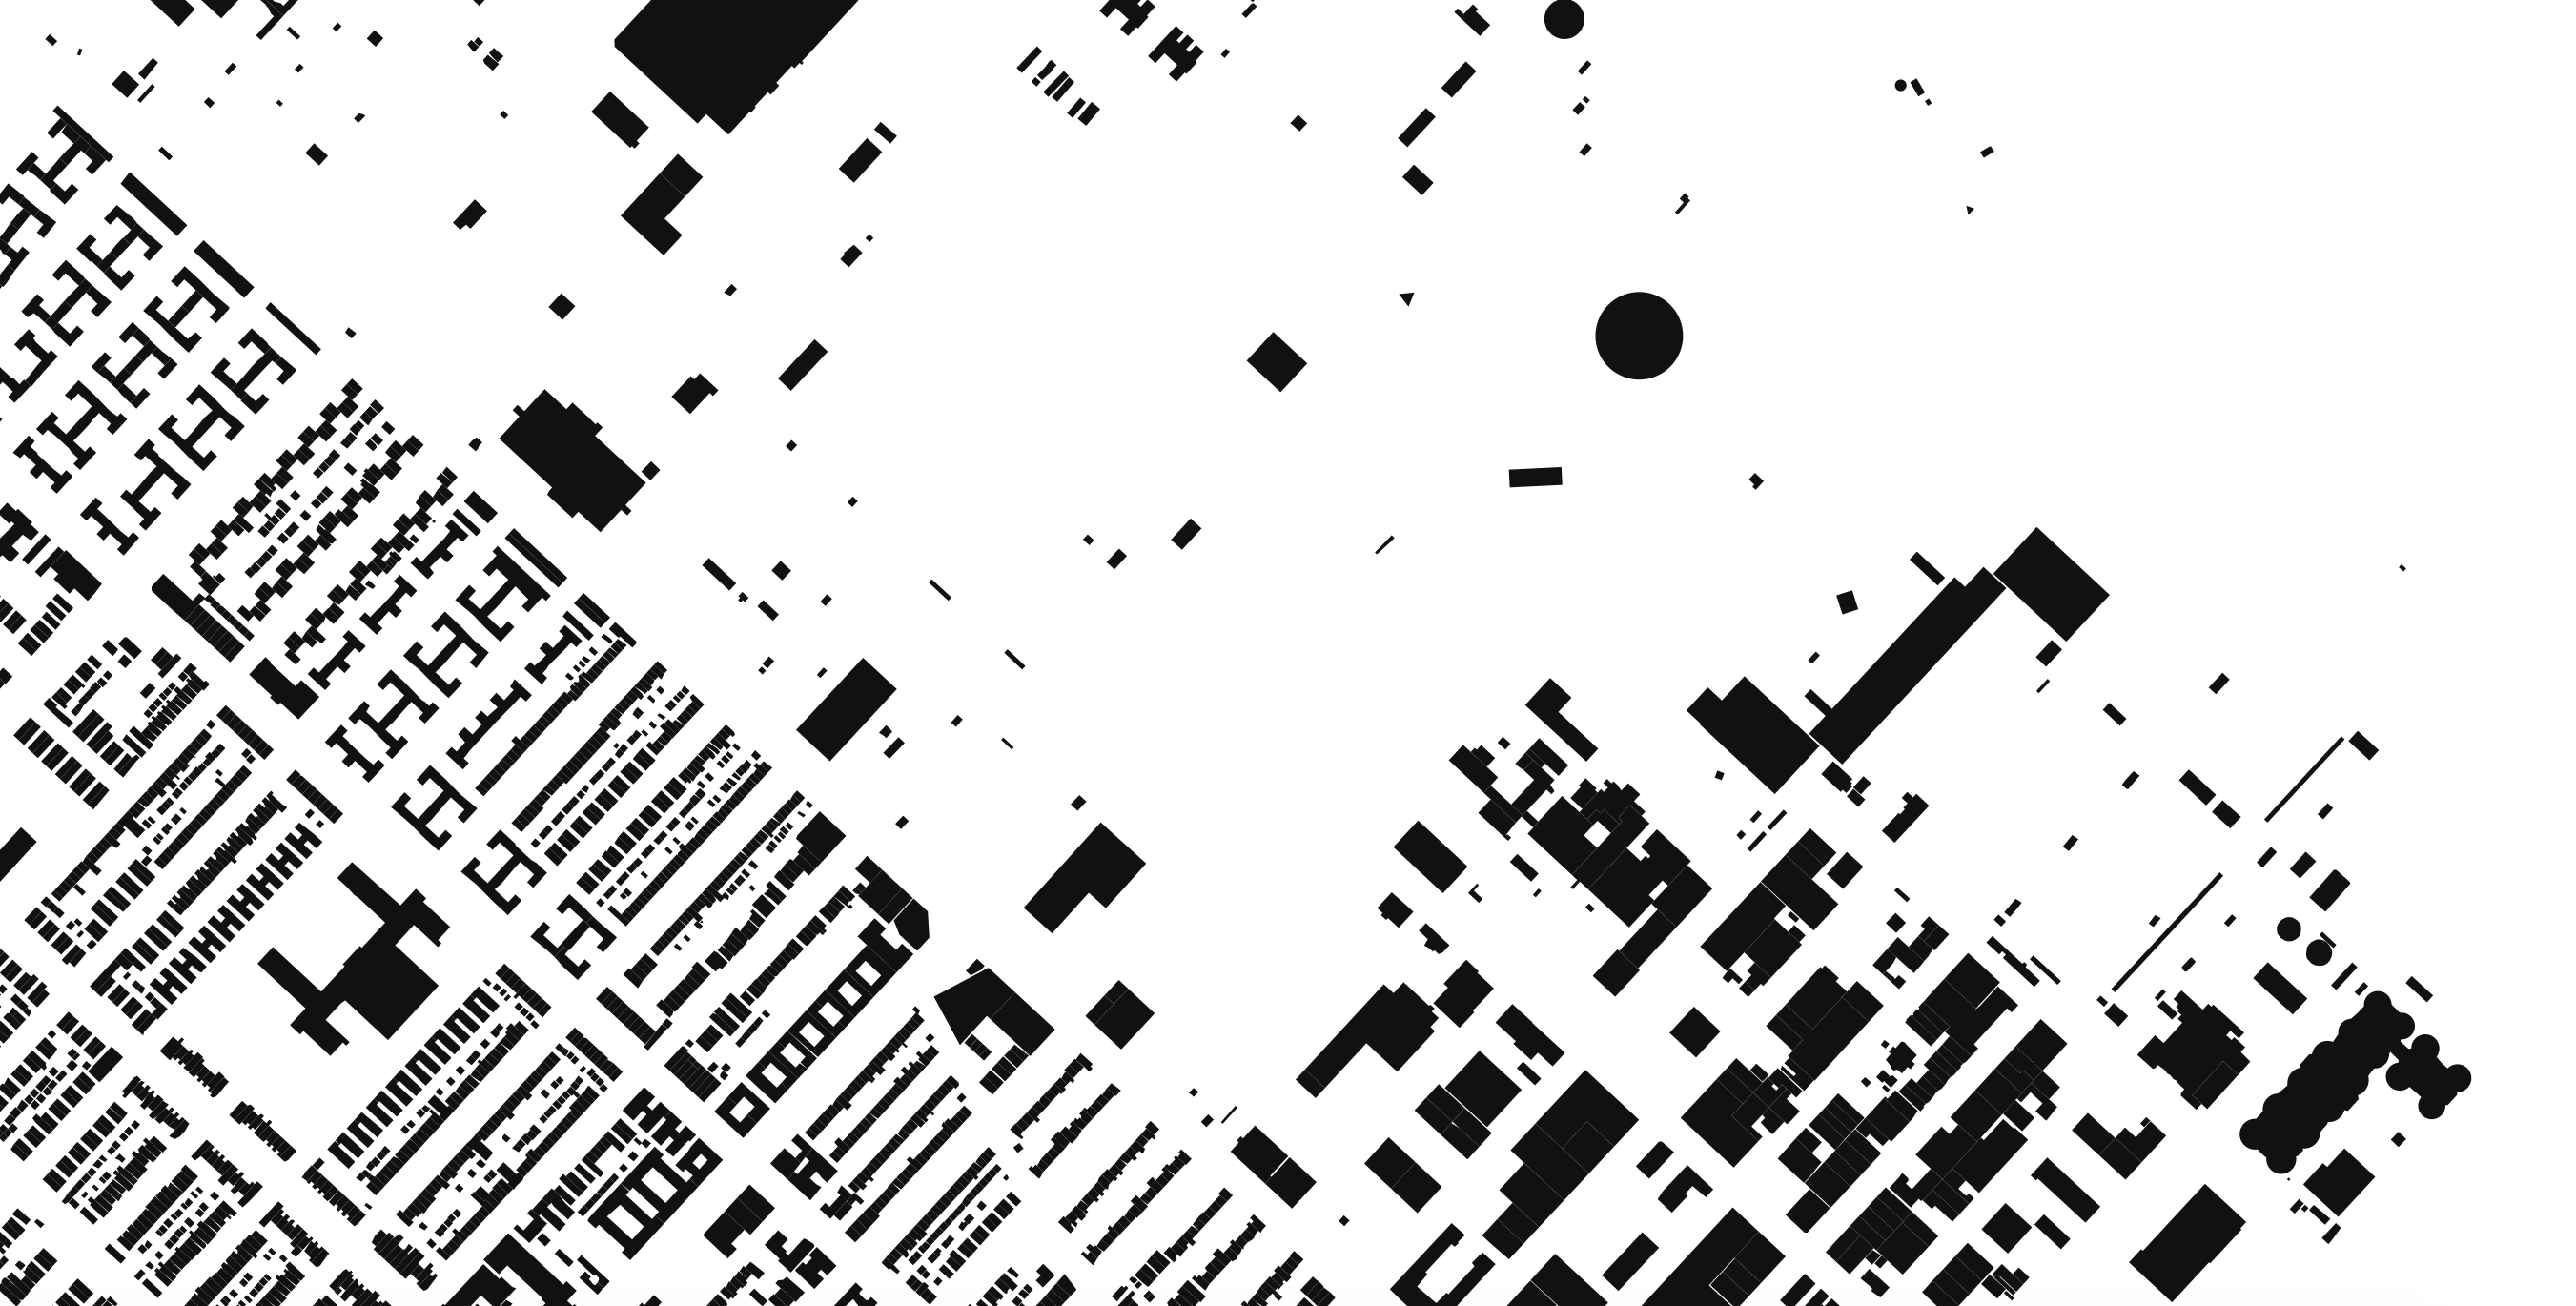
A figure-ground diagram is a mapping technique used to illustrate the relationship between built and unbuilt space in cities.| MORPHOCODE

A mix of design style guides, map making tutorials and machine learning research| MORPHOCODE
Morphocode Explorer is an interactive web tool that combines various data sources and provides a single, powerful, easy to use interface for exploring the city.| MORPHOCODE

An inspirational selection of interactive maps, web frameworks, 1955 Copenhagen and open access research| MORPHOCODE
Urban performance measures help communities make informed decisions and measure results against goals.| MORPHOCODE
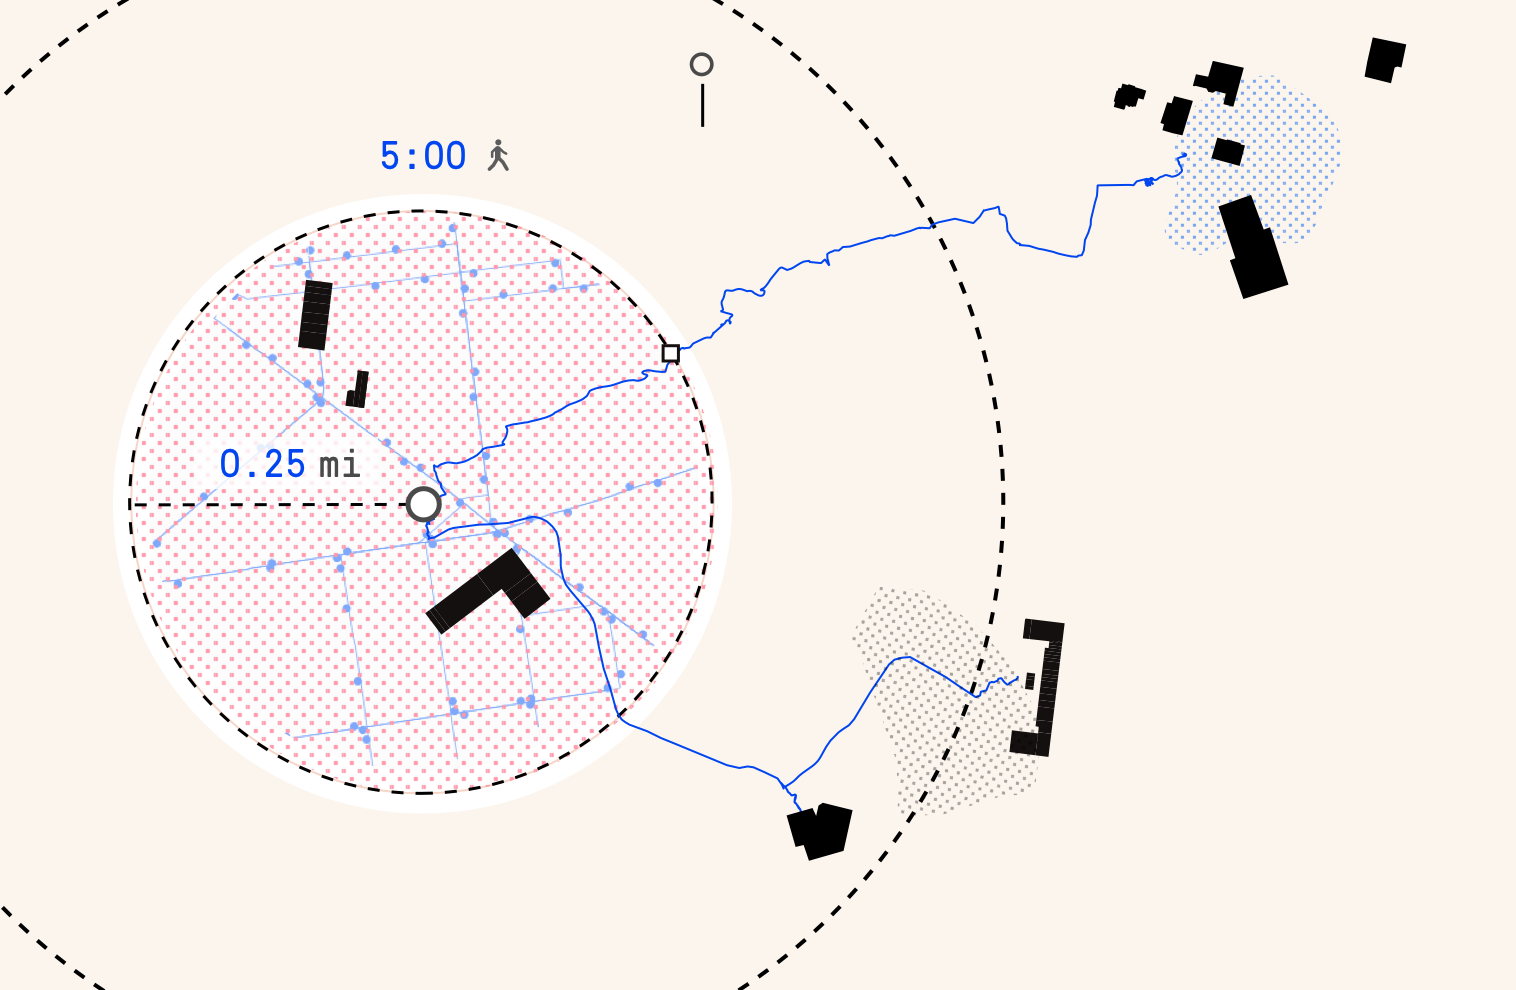
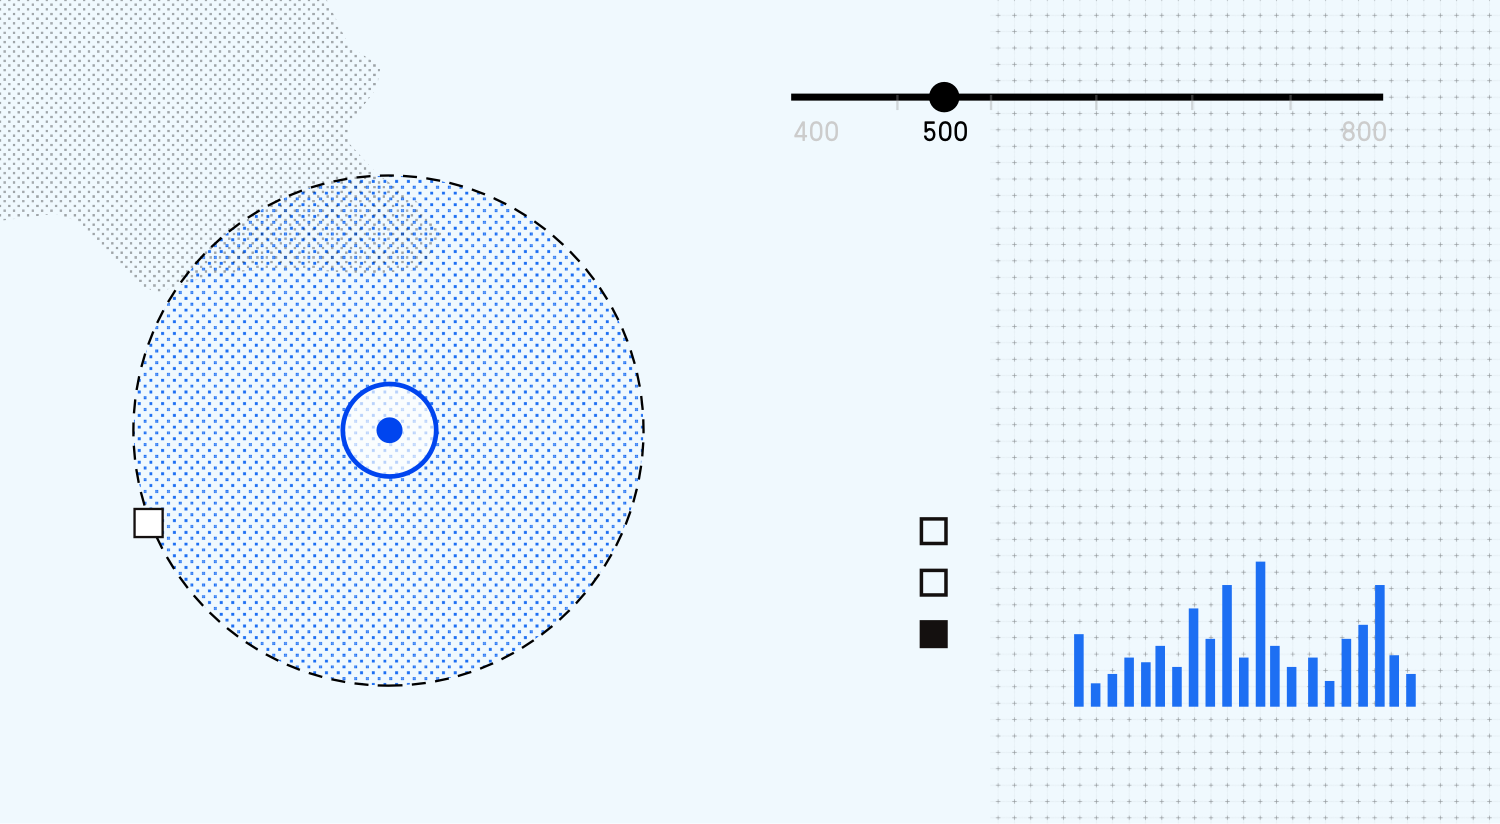
The 5-minute walk, also known as the “pedestrian shed” is considered to be the distance people are willing to walk before opting to drive.| MORPHOCODE
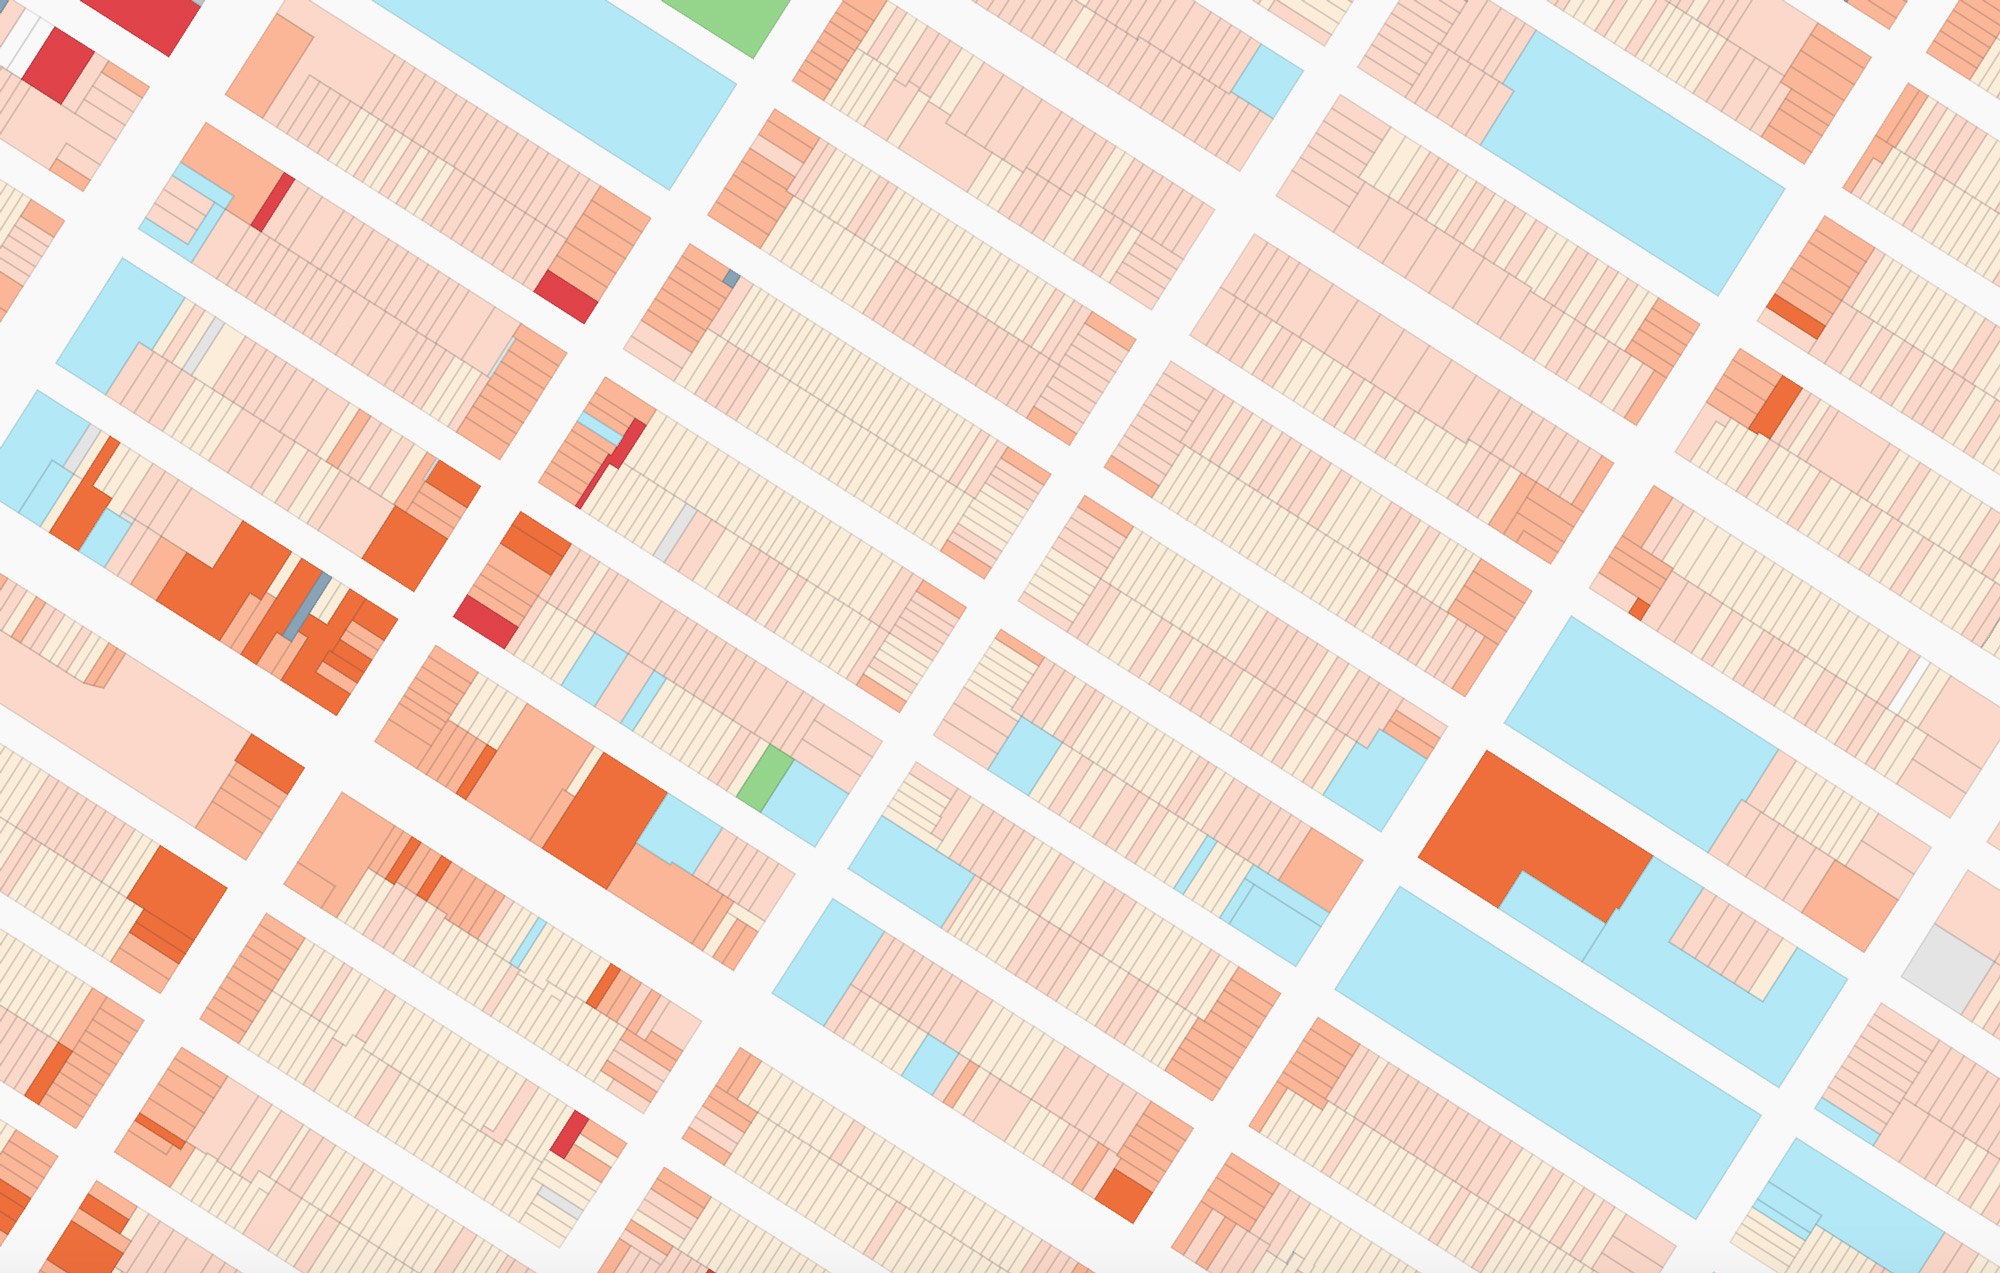
The use of color in maps and data visualizations has a long tradition. Color is one of the primary means to encode data graphically.| MORPHOCODE
