
30 Best BI Tools: Ranked, Reviewed and Summarized (2025)
In this guide, we'll go through almost all of the BI tools on the market so you can know which one is the right fit for your team.| The Holistics Blog
In this guide, we'll go through almost all of the BI tools on the market so you can know which one is the right fit for your team.| The Holistics Blog
In this article, I will walk you through key embedded features and the 12 best embedded analytics platforms on the market.| The Holistics Blog
Why Use Data Visualization Tools in Business Analytics? Data visualization tools help business teams see the shape of the problem. They convert millions of rows into dashboards, charts, and stories that execs, product managers, and marketers can act on. You'd want to look into data visualization tools when| The Holistics Blog
Metabase is a go-to for startups and small teams— but it starts to fall behind when you need more flexibility and control, and that’s when you’ll find yourself searching for an alternative. In this article, we'll look into 10 best alternatives, their pros, cons, and pricing.| The Holistics Blog
QuickSight is appealing for teams already deep in AWS, but its limitations (weak customization, rigid APIs, and poor developer experience) often push data teams to look elsewhere. If you’re scaling beyond basic dashboards or need richer semantic modeling, you’re likely outgrowing QuickSight. When to look for| The Holistics Blog
Here, we break down the Qlik Sense pricing models, how it stacks up against competitors, and what you need to know to calculate the total cost of ownership (TCO).| The Holistics Blog
When to Look for Qlik Sense Alternatives You should start exploring alternatives to Qlik Sense when you hit friction in three areas: limited adoption across teams, high total cost of ownership, or misalignment with your broader data stack. If you're building toward a self-service analytics culture or adopting| The Holistics Blog
Whether you use Shopify or WordPress, you'll outgrow the built-in dashboards. Here are some eCommerce analytics tools that can scale with you.| The Holistics Blog
In this article, we’ll break down some of the best Sisense alternatives for embedded analytics, covering strengths, limitations, and when you might want to choose them over Sisense.| The Holistics Blog
We talked to Chief Data Officers (CDOs) at enterprise organizations, many of whom are Holistics customers. Here’s what we learned about Enterprise BI.| The Holistics Blog
We look into 11 Tableau alternatives, their pros, cons and everything in between.| The Holistics Blog

Embedded analytics can vastly improve your SaaS offering, but where do you start? If you're running a software company, this article is for you| The Holistics Blog
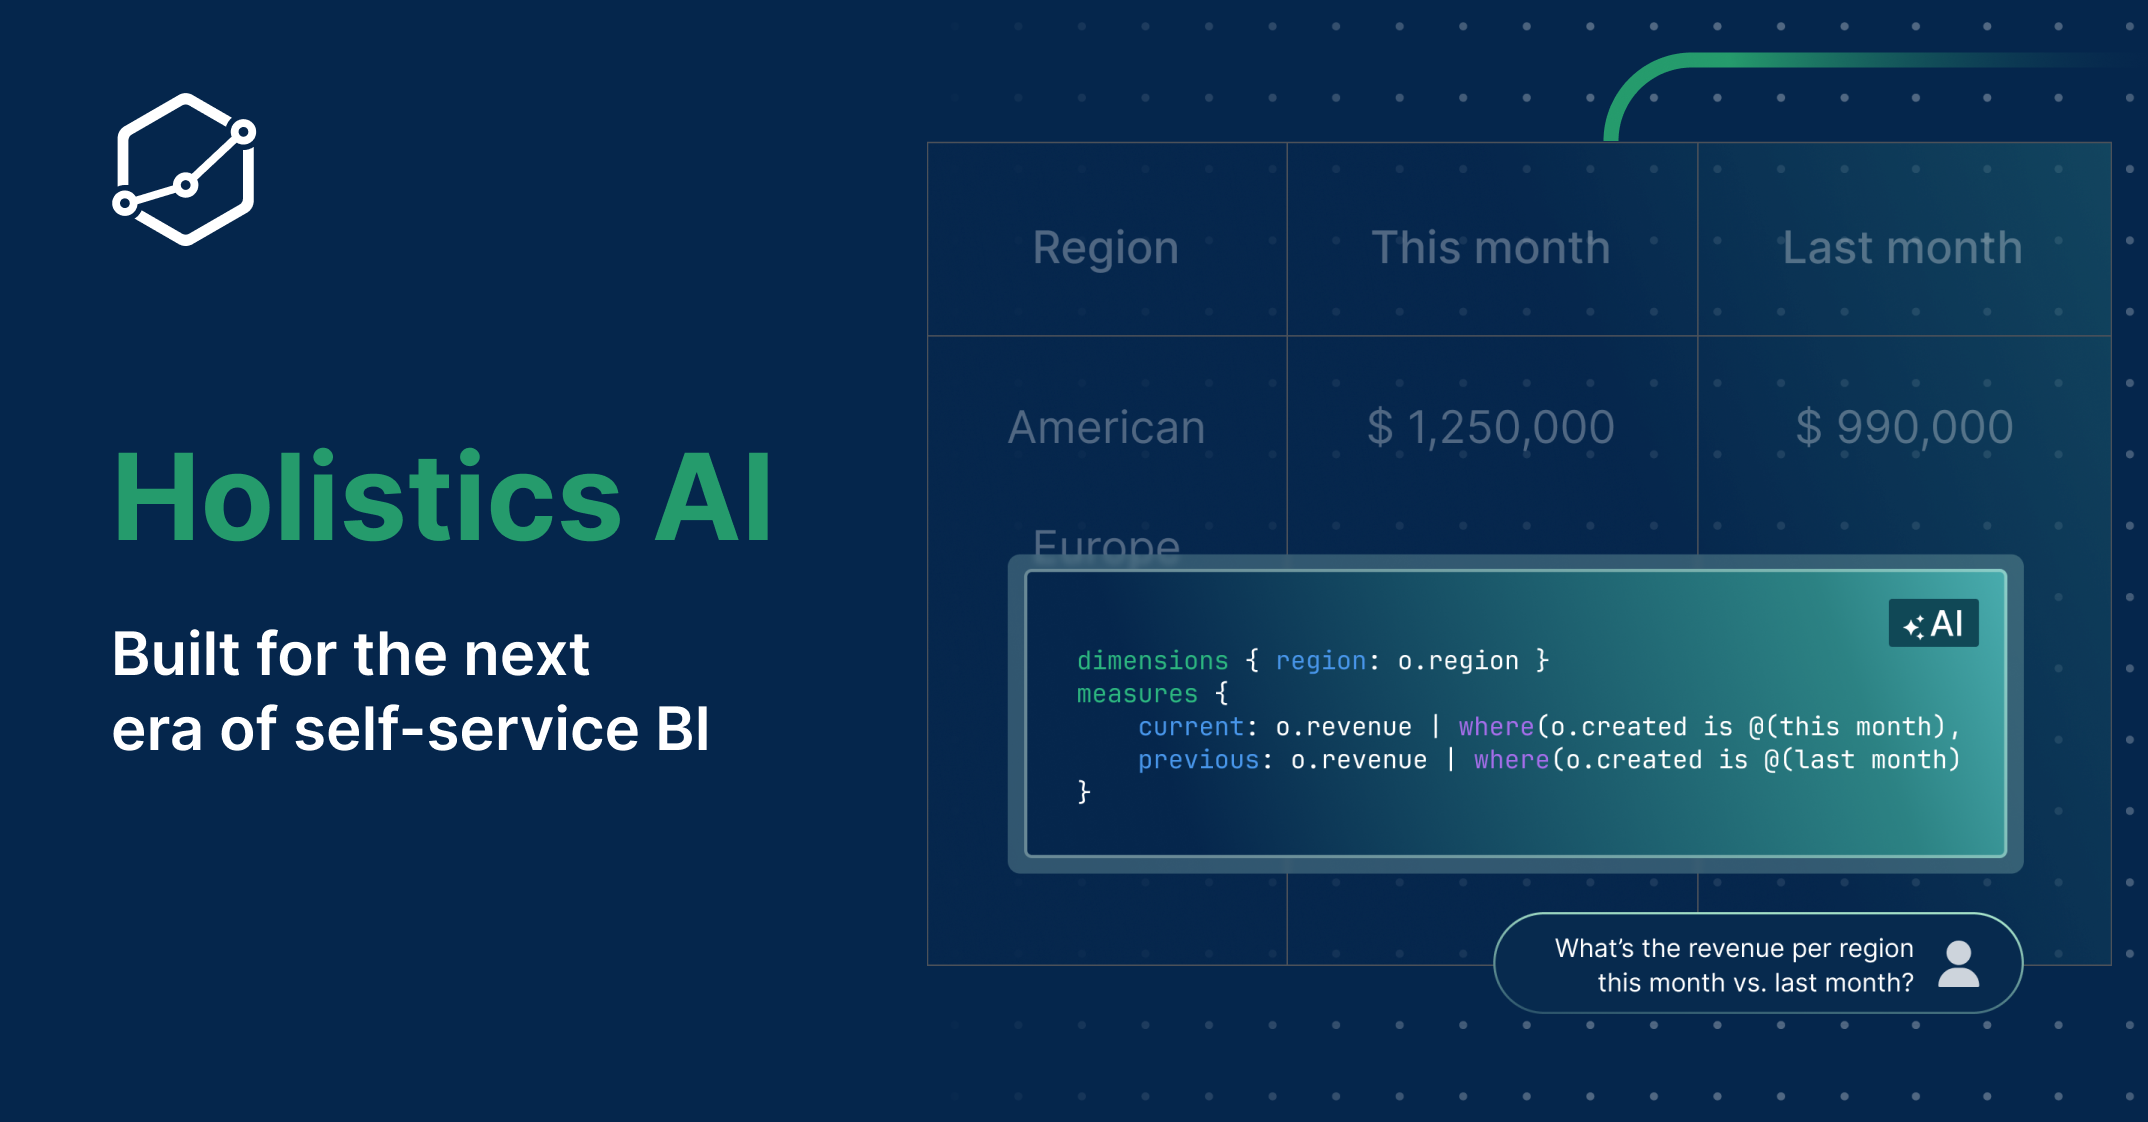
We’re introducing a simpler, faster way to explore data in Holistics: you just need to chat with Holistics AI.| The Holistics Blog
Visualizations or governed modeling? Here's everything the data communities talk about when we talk about Tableau vs Looker.| The Holistics Blog
In short, Domo pricing is at least $10K per year - but this is a modest calculation. Let's take a closer look.| The Holistics Blog
Ever stared at a chart and thought, “What am I even looking at?” Yeah, we’ve all been there. Using the wrong type of chart can be really painful.| The Holistics Blog
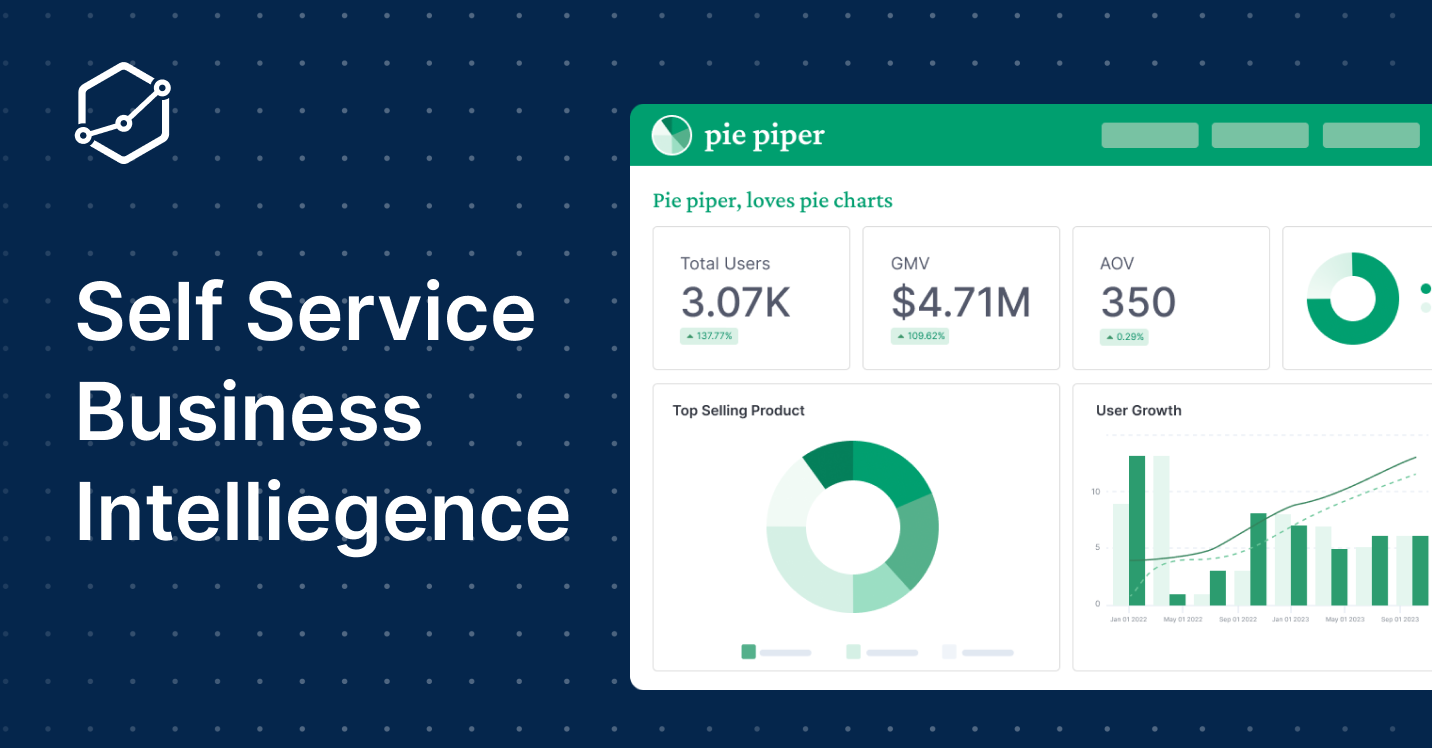
The best self-service analytics tools, pros, cons, and best practices in implementing them.| The Holistics Blog
Should you use Looker for embedded analytics and customer-facing analytics? Let's find out.| The Holistics Blog

Power BI is a powerful tool, but it doesn't support MacOS. We discuss three solutions to use Power BI on Mac devices.| The Holistics Blog

In this article, we'll review 12 open-source & affordable BI tools that data teams love to recommend, including Preset, Holistics, Lightdash, and more!| The Holistics Blog
How much does Sisense really cost? We dug through user reviews, forums, and various reports to break down everything you need to know about Sisense pricing. But if you're in a hurry and want a short answer: Sisense ballpark pricing is $21K per year.| The Holistics Blog

We put on our journalist hats. The short answer is: Looker pricing starts from $35K/year.| The Holistics Blog
In this article, we’ll explore top Looker alternatives - including Holistics, Sisense, Sigma Computing, Lightdash, and Thoughtspot. We’ll break down their features, pricing, pros, and cons so you can make a more informed decision.| The Holistics Blog

Goodhart's law says that 'when a measure becomes a target, it fails to become a good measure. Here are four ways that occurs.| The Holistics Blog
Why are so few data analysts get good at business problem-solving?| The Holistics Blog
How Amazon uses metrics. A summary of chapter 6 of Working Backwards, the first book to explain how Amazon really works.| The Holistics Blog
In this blog, we share the BI comparison matrix and an RFP template to help you compare BI tools more easily.| The Holistics Blog
Architecturally similar to Lightdash, with a BI as-code approach and self-service analytics layer, but more mature in functionalities.| The Holistics Blog
Grafana is a widely open-source platform for monitoring visualization that was first introduced in 2014. The application, developed by Torkel Ödegaard, is a well-liked option for programmers who want to query, visualize, and create alerts on time-series data gathered from a plethora of data sources, including InfluxDB, Prometheus, and Elasticsearch.| The Holistics Blog
