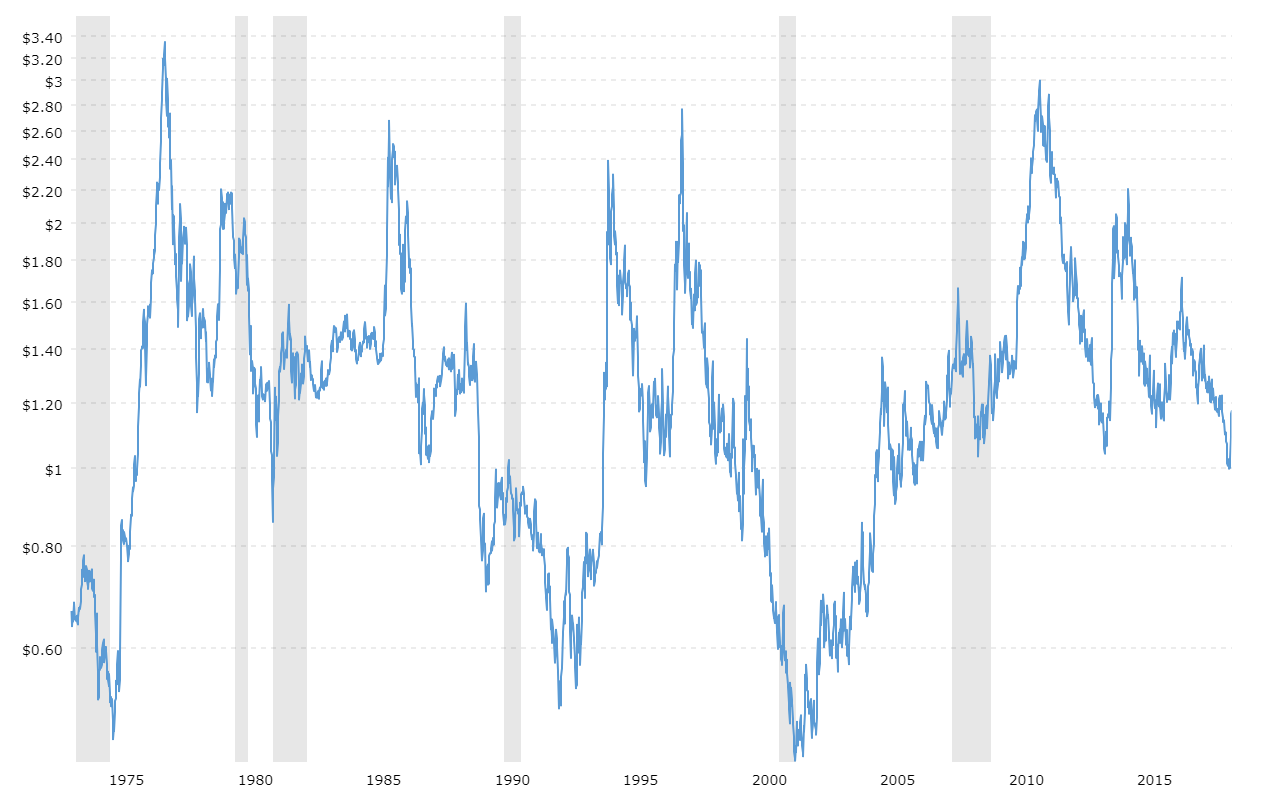
Coffee Prices (1969-2025)
Interactive chart of historical daily coffee prices back to 1969. The price shown is in U.S. Dollars per pound.| www.macrotrends.net
Current and historical operating margin for Match Group (MTCH) over the last 10 years. The current operating profit margin for Match Group as of June 30, 2025 is 16.31%.| www.macrotrends.net
Current and historical operating margin for Apple (AAPL) over the last 10 years. The current operating profit margin for Apple as of June 30, 2025 is 26.80%.| www.macrotrends.net
Trade Desk annual/quarterly revenue history and growth rate from 2015 to 2025. Revenue can be defined as the amount of money a company receives from its customers in exchange for the sales of goods or services. Revenue is the top line item on an income statement from which all costs and expenses are subtracted to arrive at net income. Trade Desk revenue for the quarter ending June 30, 2025 was $0.694B, a 18.73% increase year-over-year. Trade Desk revenue for the twelve months ending June 30, ...| www.macrotrends.net
Interactive chart showing the daily 10 year treasury yield back to 1962. The 10 year treasury is the benchmark used to decide mortgage rates across the U.S. and is the most liquid and widely traded bond in the world.| www.macrotrends.net
Etsy annual/quarterly revenue history and growth rate from 2013 to 2025. Revenue can be defined as the amount of money a company receives from its customers in exchange for the sales of goods or services. Revenue is the top line item on an income statement from which all costs and expenses are subtracted to arrive at net income. Etsy revenue for the quarter ending June 30, 2025 was $0.673B, a 3.84% increase year-over-year. Etsy revenue for the twelve months ending June 30, 2025 was $2.838B, a...| www.macrotrends.net
Amazon annual/quarterly revenue history and growth rate from 2010 to 2025. Revenue can be defined as the amount of money a company receives from its customers in exchange for the sales of goods or services. Revenue is the top line item on an income statement from which all costs and expenses are subtracted to arrive at net income. Amazon revenue for the quarter ending June 30, 2025 was $167.702B, a 13.33% increase year-over-year. Amazon revenue for the twelve months ending June 30, 2025 was $...| www.macrotrends.net
Interactive chart of historical daily coffee prices back to 1969. The price shown is in U.S. Dollars per pound.| www.macrotrends.net
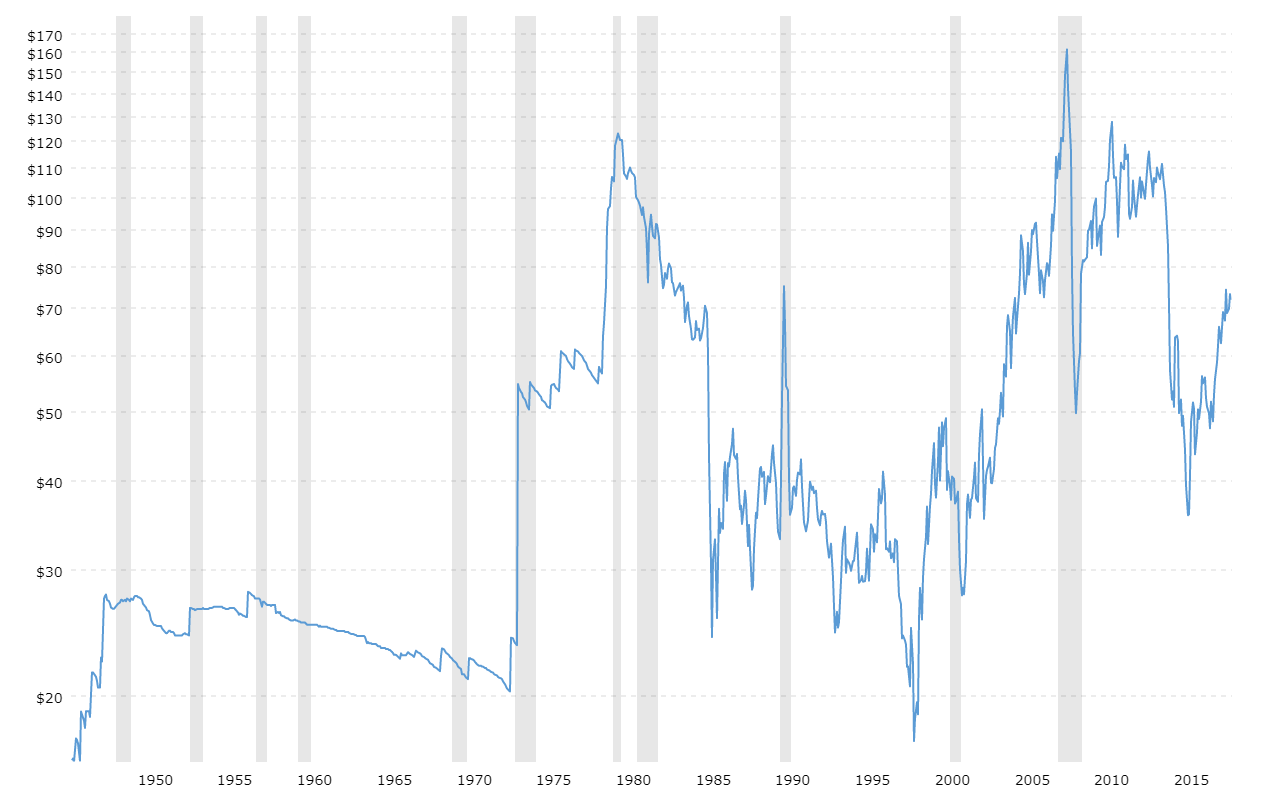
Interactive charts of West Texas Intermediate (WTI or NYMEX) crude oil prices per barrel back to 1946. The price of oil shown is adjusted for inflation using the headline CPI and is shown by default on a logarithmic scale. The current month is updated on an hourly basis with today's latest value.| www.macrotrends.net
