Rolex stock is not available to buy on any stock exchange. There is no publicly available Rolex stock because Rolex SA is a privately held company 100% owned by The Hans Wilsdorf Foundation, a Swiss charity.| Liberated Stock Trader
Lot size refers to the standardized number of units of a security or asset involved in a transaction. By ensuring uniformity in trade volumes, lot sizes facilitate the smoother functioning of financial markets.| Liberated Stock Trader
If you are a beginner day trader with limited skills and no strategy, then day trading is gambling. However, at a professional level, day trading and gambling are more like running a business; both require a systematic methodology, risk management, skill, and experience to be successful.| Liberated Stock Trader
My tests show that the best free real-time quotes and live stock charts are available on TradingView, Firstrade, TC2000, and Yahoo Finance. Real-time stock quotes cost money, but these companies provide exchange data and charts for free.| Liberated Stock Trader
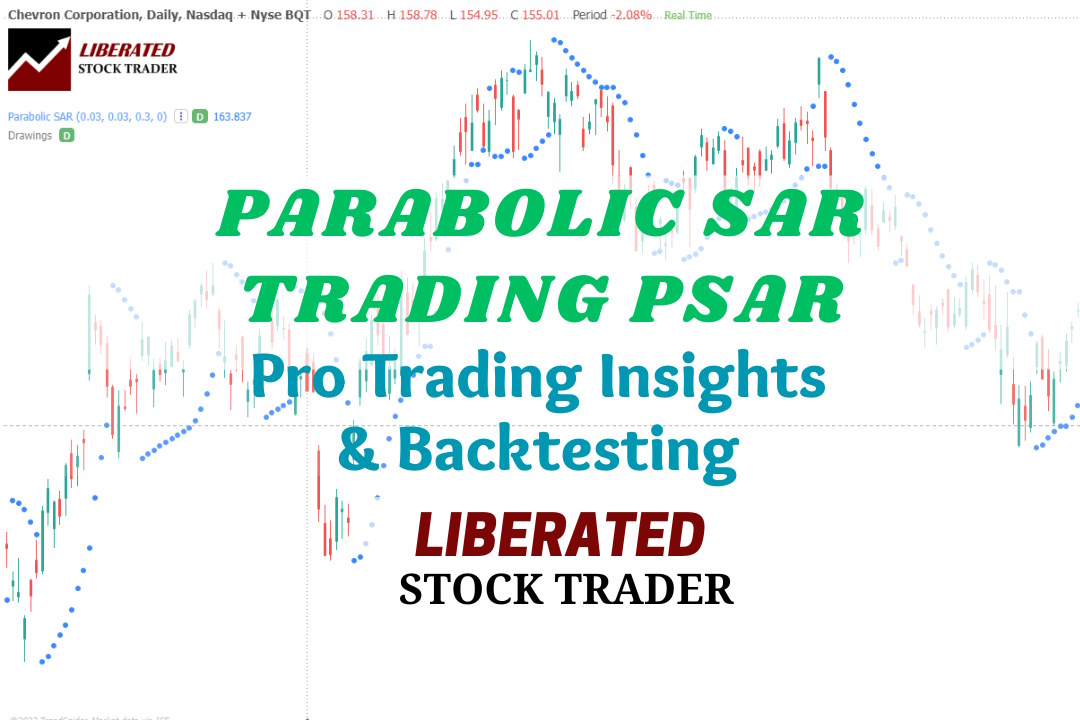
I backtested seven Parabolic SAR setups across 1-minute to daily charts for the DJ30 stocks over 12 years, resulting in over 2,880 years of test data. On standard charts, PSAR is not a profitable trading indicator. However, I did discover an incredibly profitable PSAR configuration.| Liberated Stock Trader
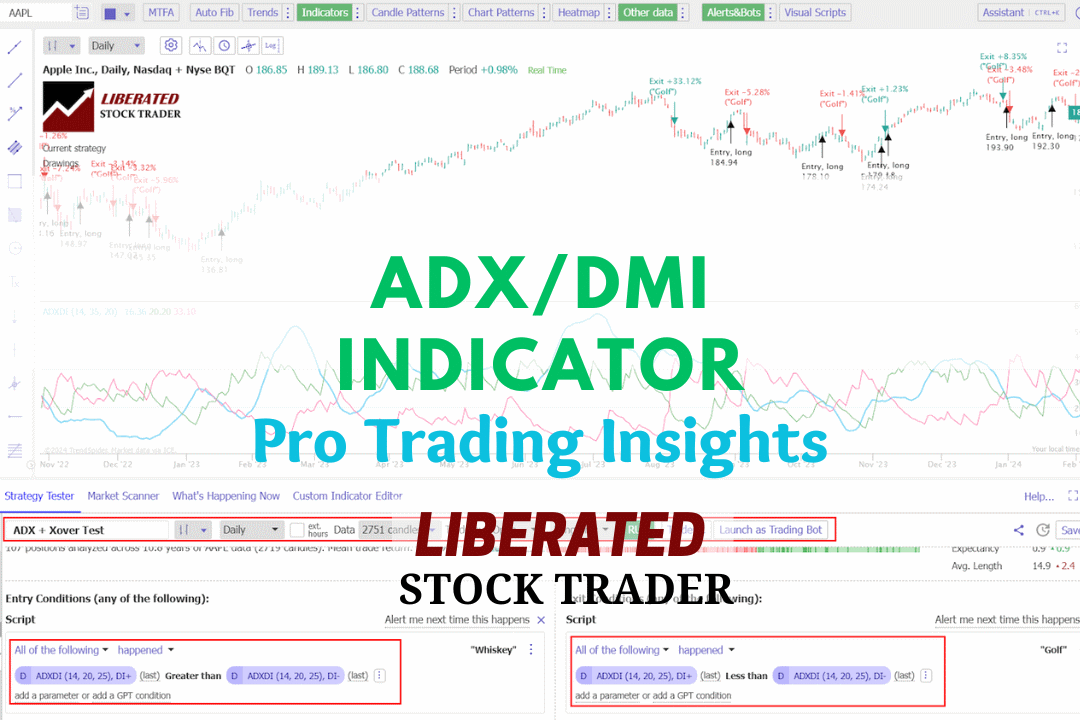
My testing, based on 9,764 trades over 25 years, demonstrates that the DMI indicator is both profitable and reliable, outperforming the S&P 500 index. Here's how to trade it based on the data.| Liberated Stock Trader
Data-driven research, education, and insights for independent investors. We test charts, patterns, indicators, and develop unique growth, dividend, and value investing strategies.| Liberated Stock Trader
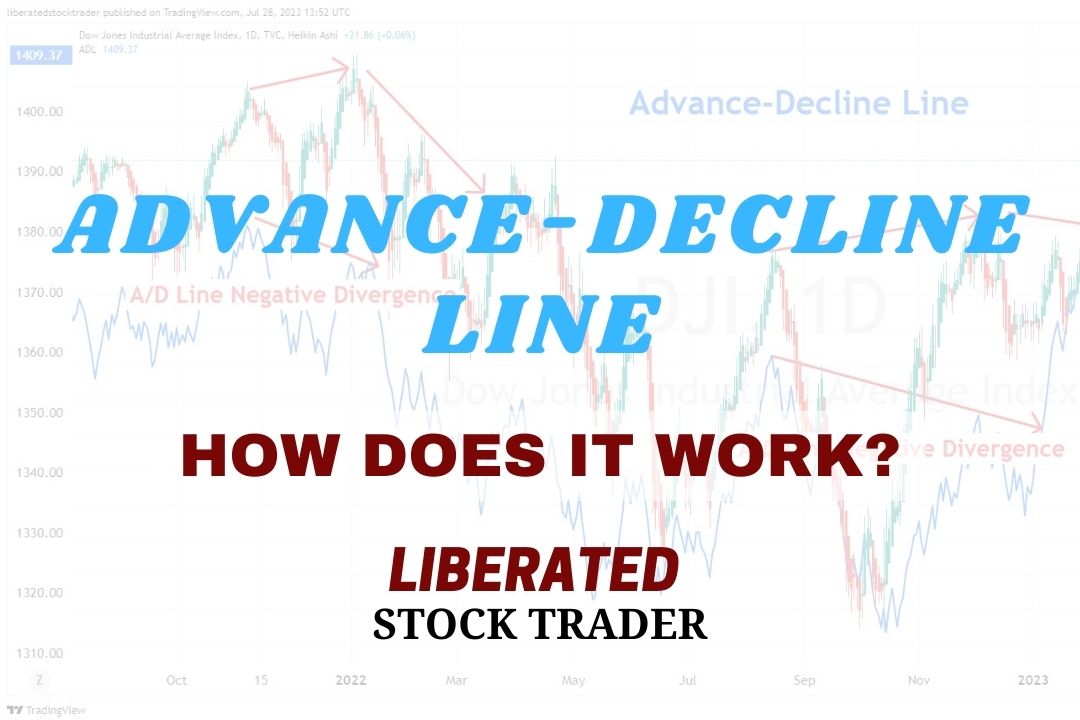
The advance/decline (A/D) line indicator measures market breadth by identifying how many stocks participate in a market advance or decline. It is calculated by taking the number of advancing stocks minus the declining stocks.| Liberated Stock Trader
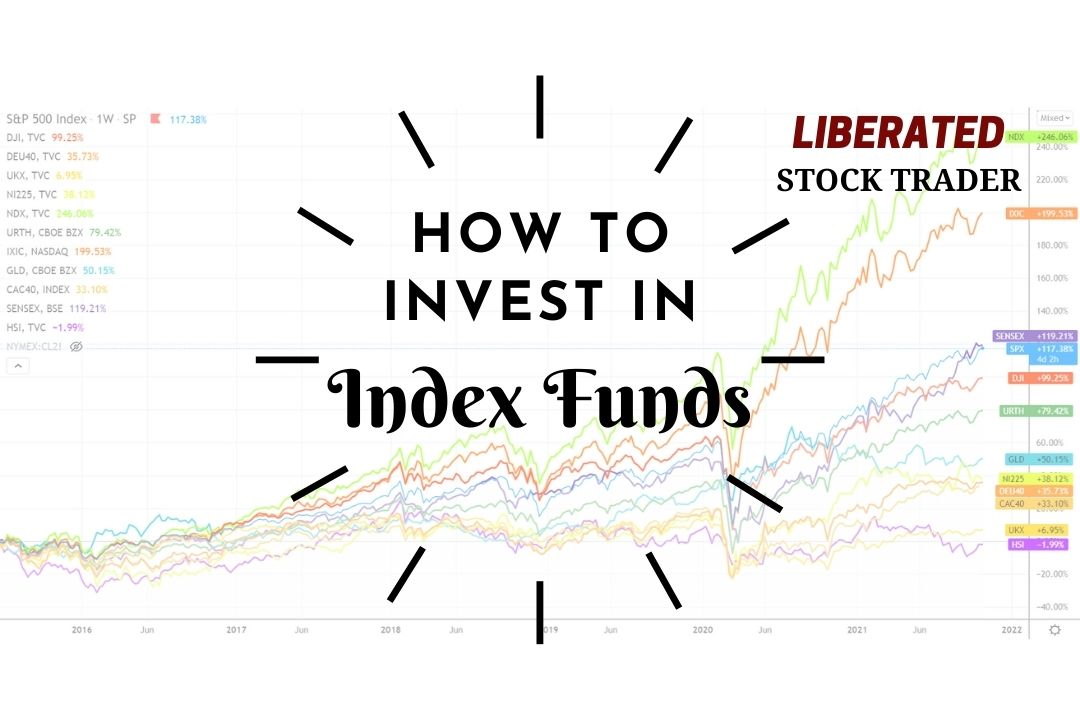
Investing in index funds is a great way to diversify your portfolio and reduce risk. Index funds track the performance of major stock market indices, such as the S&P 500 or Dow Jones Industrial Average. Index funds are low-cost and have been shown to outperform actively managed mutual funds in the long run.| Liberated Stock Trader
Professional stock screening requires a clear investing methodology based on growth, value, dividend, or short-term trading. Next, select the right tools and implement your specific criteria.| Liberated Stock Trader
Kalshi opens up a new world of regulated trading of event contracts. It's a fascinating way to explore market sentiment and profit from outcomes.| Liberated Stock Trader
In my testing, Trade Ideas scores 4.7/5.0 and Finviz scores 4.3/5.0. Trade Ideas stands out with AI-generated, real-time trade signals, integrated backtesting, and automation, while Finviz excels in visual screening, heatmaps, and no-code backtesting in its Elite plan.| Liberated Stock Trader
In my testing, TradingView scores 4.8/5.0 because it excels in charting, screening, and backtesting globally, whereas ThinkOrSwim scores 4.3/5.0 due to its limited community, inferior charting features, and clunky interface.| Liberated Stock Trader
Research indicates that the most reliable and profitable stock chart patterns include the inverse head and shoulders, double bottom, triple bottom, and| Liberated Stock Trader
Renko charts filter out unnecessary price fluctuations to provide a clear stock price trend that traders can use in their investing strategies.| Liberated Stock Trader
Trendlines are a visual representation of the trend direction in the stock market. They are formed by connecting two or more significant highs or lows on a stock chart, creating a diagonal line that indicates the general trend of the asset's price movement.| Liberated Stock Trader
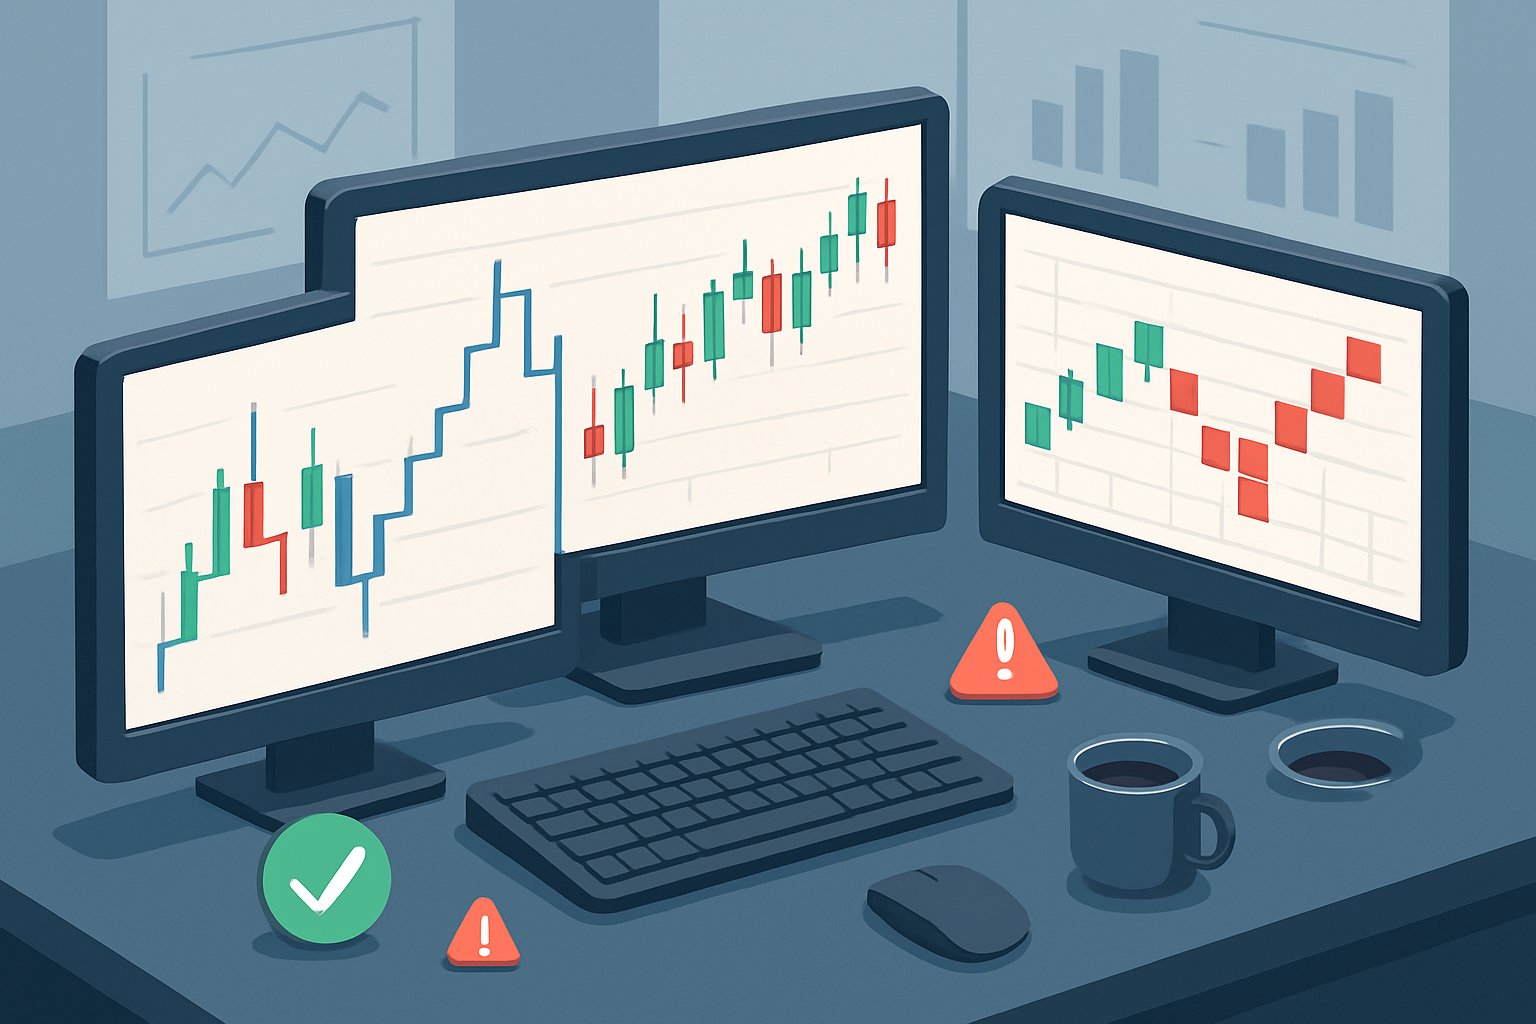
A sell signal gives traders a heads-up on when to consider closing positions, helping them lock in gains or cut losses using actual triggers, not just hunches.| Liberated Stock Trader
Price action trading is a method of day trading that relies on technical analysis but ignores conventional fundamental indicators, focusing instead on the movement of prices.| Liberated Stock Trader
Swing Trading and Day Trading differ in the timeframe, strategy, tools, and leverage. Day traders trade intraday using leverage; swing traders hold positions for days or weeks. Swing traders use real-time news, patterns, and indicators to make decisions, whereas day traders typically look for volatility to enable price scalping.| Liberated Stock Trader
My research indicates that the most effective chart types for traders are Heikin-Ashi, Candlestick, OHLC, Raindrop, and Renko charts. These charts provide the optimal balance of price and trend reversal information to help investors develop effective trading strategies.| Liberated Stock Trader
A buy signal is essentially an indicator or event that suggests it may be a good time to purchase a particular stock, whether based on technical data, chart patterns, or intrinsic value.| Liberated Stock Trader
Most AI trading tools do not use real AI machine learning and large language models. The majority of self-proclaimed AI trading tools are algorithmic and do not actually learn.| Liberated Stock Trader
Inventory to Sales Ratio is a crucial financial metric indicating the relationship between a company's inventory and sales volume. It sheds light on the efficiency of inventory management and plays a significant role in assessing performance against industry benchmarks.| Liberated Stock Trader
FCCR is a financial metric determining how well a business can cover its fixed charges with its operating income. It is calculated by dividing Earnings Before Interest and Taxes (EBIT) by fixed charges. Fixed charges typically include expenses such as interest expense and lease payments.| Liberated Stock Trader
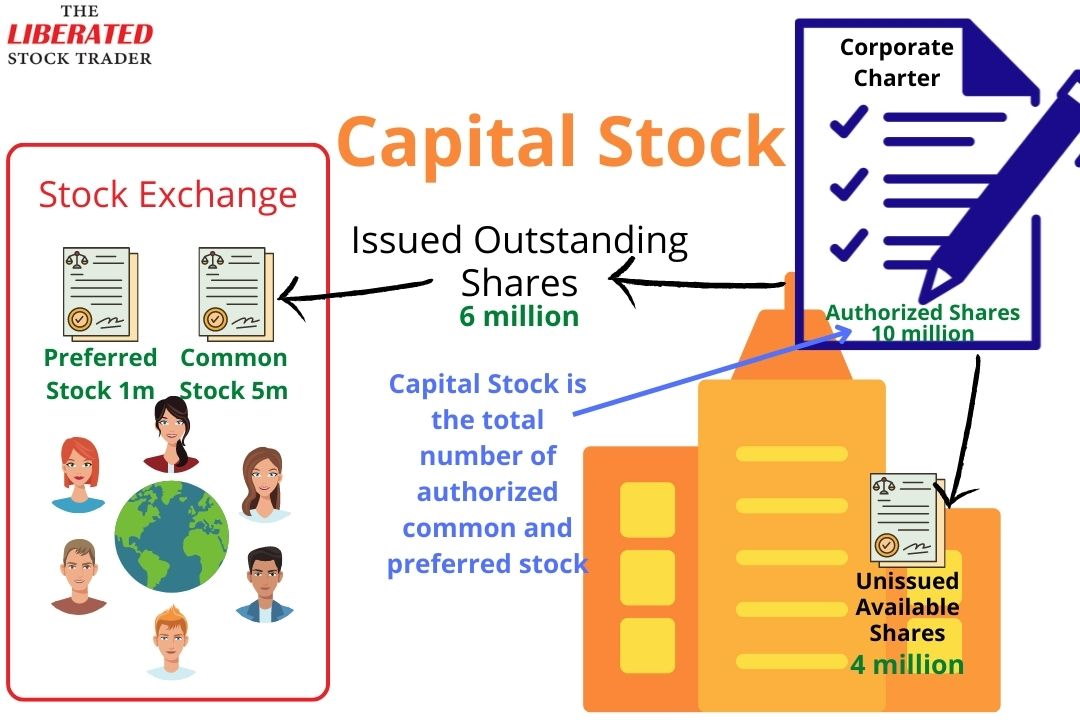
Common stock has voting rights and price appreciation in line with market prices, whereas preferred stock does not. However, preferred stock has higher priority dividend payments and liquidity rights in case of insolvency. The downside of preferred stock is that it has no voting rights, and they are callable.| Liberated Stock Trader
Preferred stock dividends are a form of payment made to preferred stock shareholders. Preferred stock is a type of ownership in a company granting privileges such as priority over common stockholders in the event of bankruptcy or liquidation.| Liberated Stock Trader
You can safely invest in index funds through mutual fund companies or as an index ETF directly through your broker. Investing in an index fund ETF is the most cost-effective, liquid, and efficient way to diversify your portfolio.| Liberated Stock Trader
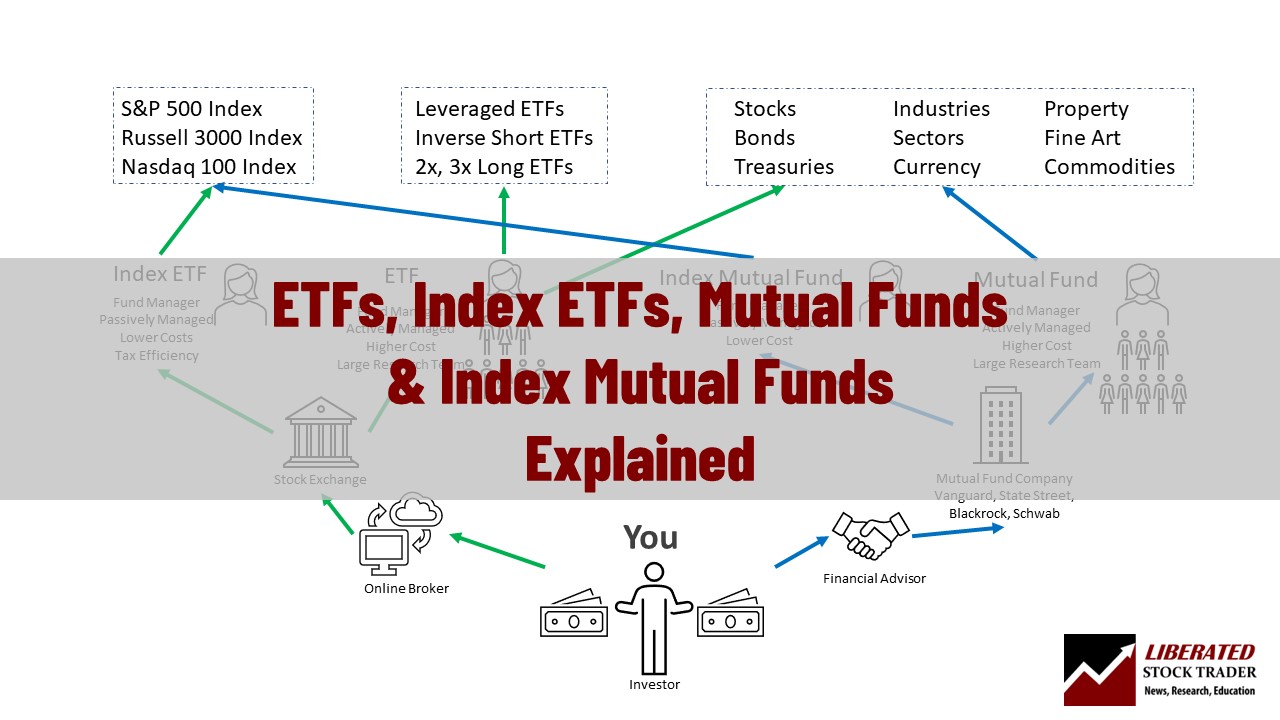
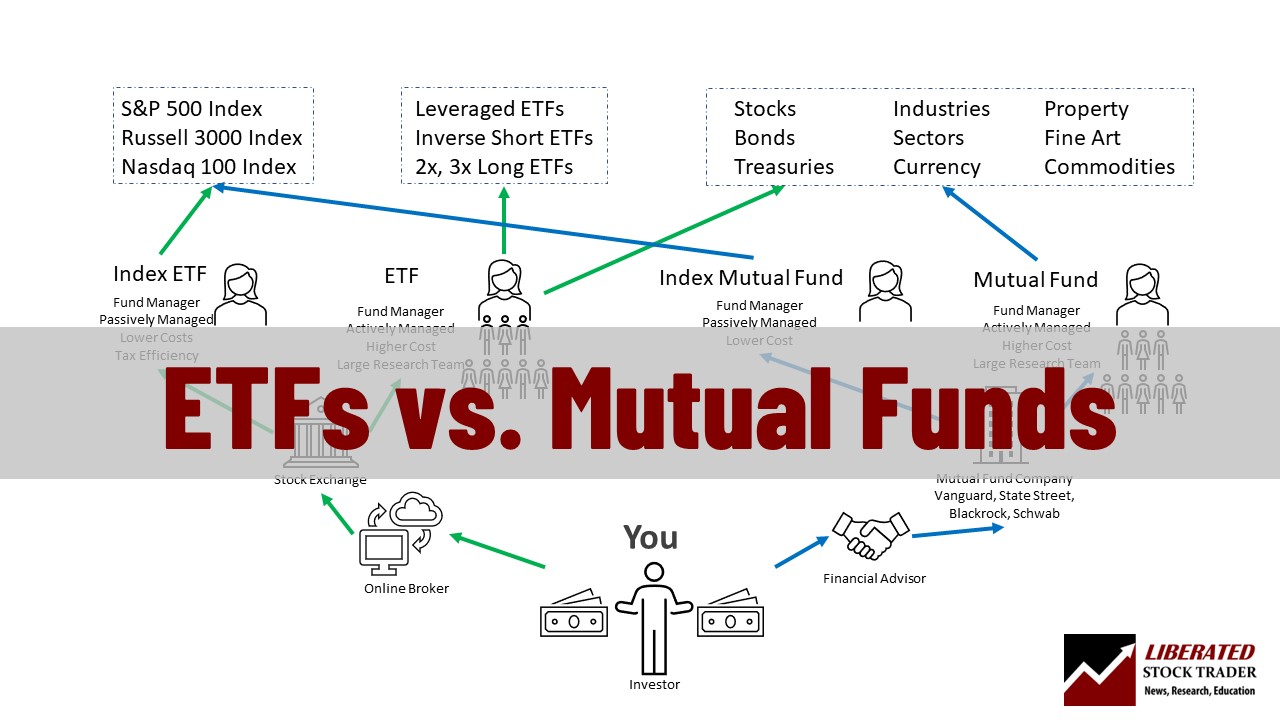
The difference between ETFs, mutual funds, and index funds is ETFs trade like stocks on an exchange, mutual funds are actively managed private investments, and an index fund can be either an ETF or a mutual fund.| Liberated Stock Trader
Learn technical analysis and how to read stock charts. This helps you understand the movement of stock prices, stock trends, and the supply-demand equation. Stock chart indicators and market sentiment are all important factors.| Liberated Stock Trader
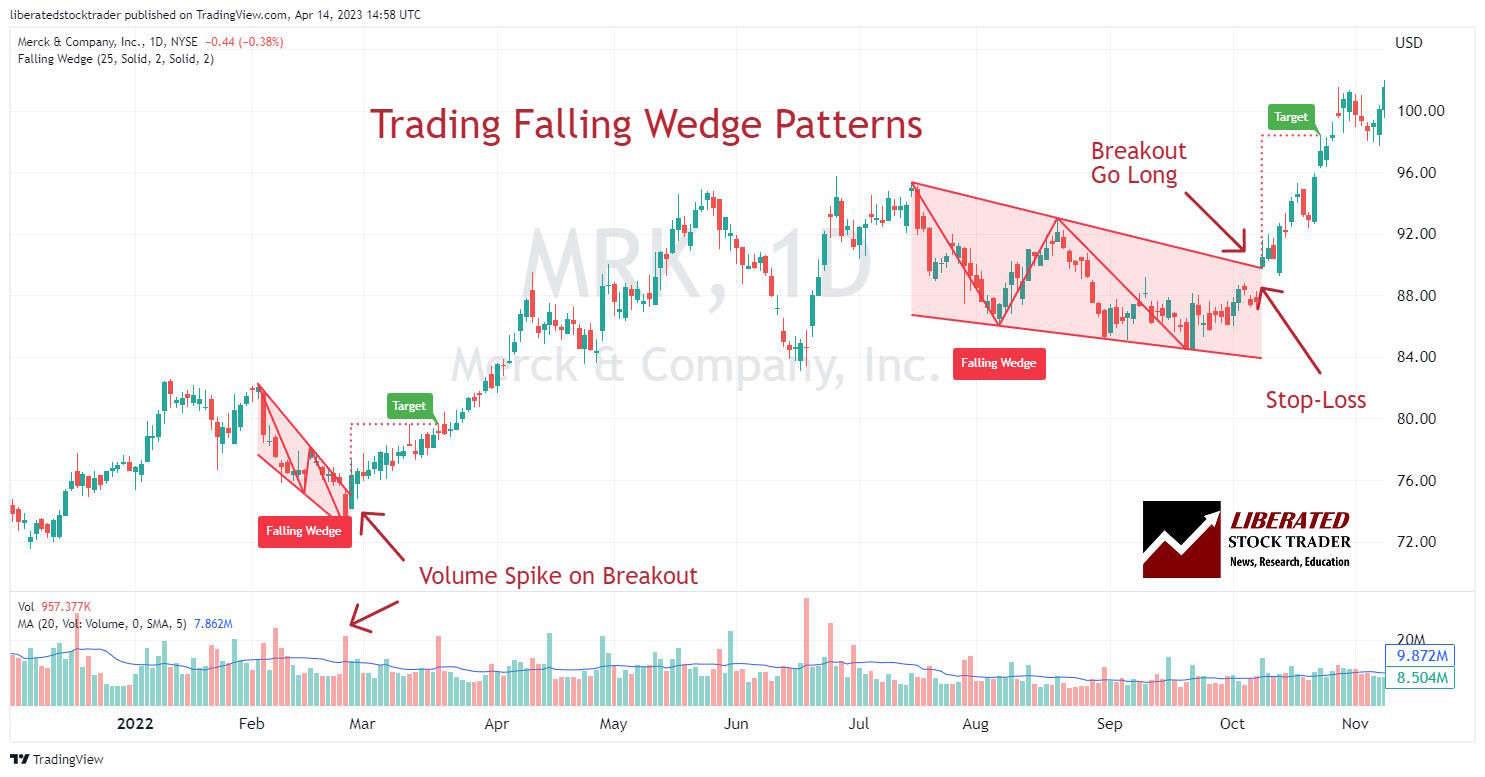
According to published research, the falling wedge pattern has a 74% success rate in bull markets with an average potential profit of +38%.| Liberated Stock Trader
One of our methods of sharing information is through our podcast series, where we discuss various topics related to stock market investing. These podcasts are| Liberated Stock Trader
My calculations suggest Jordan Belfort's net worth is close to -$40 million when considering his sizable income and outstanding -$97.5 million debt to 1,513 victims of the Stratton Oakmont scam.| Liberated Stock Trader
The Times Interest Earned Ratio assesses the number of times a company could cover its interest payments with its current pretax earnings. It offers a clear view of financial health, particularly regarding solvency and risk.| Liberated Stock Trader
Investment turnover is calculated by comparing a business's revenue to the sum of its equity and debt, providing insight into the company's management's ability to deploy its financial resources.| Liberated Stock Trader
The Price to Earnings Ratio is a commonly misunderstood calculation for determining a company's relative value. The PE Ratio is only useful for comparing companies in the same industry with similar business models. It should not be used to compare radically different businesses.| Liberated Stock Trader
The Price/Earnings to Growth (PEG) ratio helps investors find growth at a reasonable price. The PEG ratio is an incredibly valuable metric calculated by dividing the Price-to-Earnings (P/E) ratio by the company's earnings growth rate.| Liberated Stock Trader
Market makers provide liquidity by constantly being ready to buy or sell a particular security, ensuring that trades can be executed quickly and at fair prices.| Liberated Stock Trader
Freeriding refers to an investor buying and then selling securities in a cash account without having the necessary settled funds to cover the purchase. This action violates regulations set forth by governing financial bodies and can lead to a freeze on the investor's ability to trade.| Liberated Stock Trader
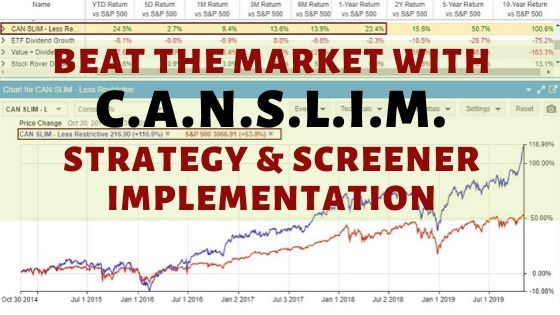
CANSLIM is an active investment strategy that utilizes specific screening criteria such as earnings, market leadership, product innovation, institutional ownership, and stock price trends. These key criteria play a vital role in the process of stock selection.| Liberated Stock Trader
Our data analysis for the past decade shows that growth stocks have outperformed value stocks. Growth investing has shown a remarkable return rate of 523%, while value investing has yielded 247%.| Liberated Stock Trader
Alpha measures a stock, fund, or asset's performance relative to its benchmark. It is often expressed as a percentage. For example, if an investment increases in value by 10 percent but the market benchmark increases by 5 percent, then the alpha would be +5%.| Liberated Stock Trader
Investment strategies enable you to organize your approach to investing. Do you seek a regular income through dividends? Do you seek high growth companies? Or are you a bargain hunter looking for a value investment?| Liberated Stock Trader
Investors need to ensure that the stocks they hold meet specific criteria set by the IRS to take advantage of qualified dividends. These criteria include holding the stock for 60 days for common stock and 90 days for preferred stock.| Liberated Stock Trader
Capital stock, also called authorized shares or authorized capital, is the maximum number of shares a company can issue to shareholders. A corporation's charter declares the number and type of stock it can issue, so no more than this amount can be issued.| Liberated Stock Trader
The P/B ratio compares a company's market value to its book value, revealing how much investors are willing to pay for each dollar of a company's net assets.| Liberated Stock Trader
To find high-yield dividend stocks requires scanning for key criteria such as dividend yield, growth, payout ratio, and EPS. A safer and more profitable strategy will incorporate value investing criteria like margin of safety and price to sales.| Liberated Stock Trader
Our free interactive Wall Street Cheat Sheet helps you get ahead of the game by navigating the emotional highs and lows that investors face during market cycles.| Liberated Stock Trader
Trade Ideas excels at real-time scanning and AI-generated trade recommendations, while TrendSpider dominates in automated chart pattern recognition, backtesting, and AI models.| Liberated Stock Trader
As a Professional market analyst, I build effective trading strategies using techniques such as indicator divergences, multi-time frame analysis, indicator combinations, and rigorous backtesting.| Liberated Stock Trader
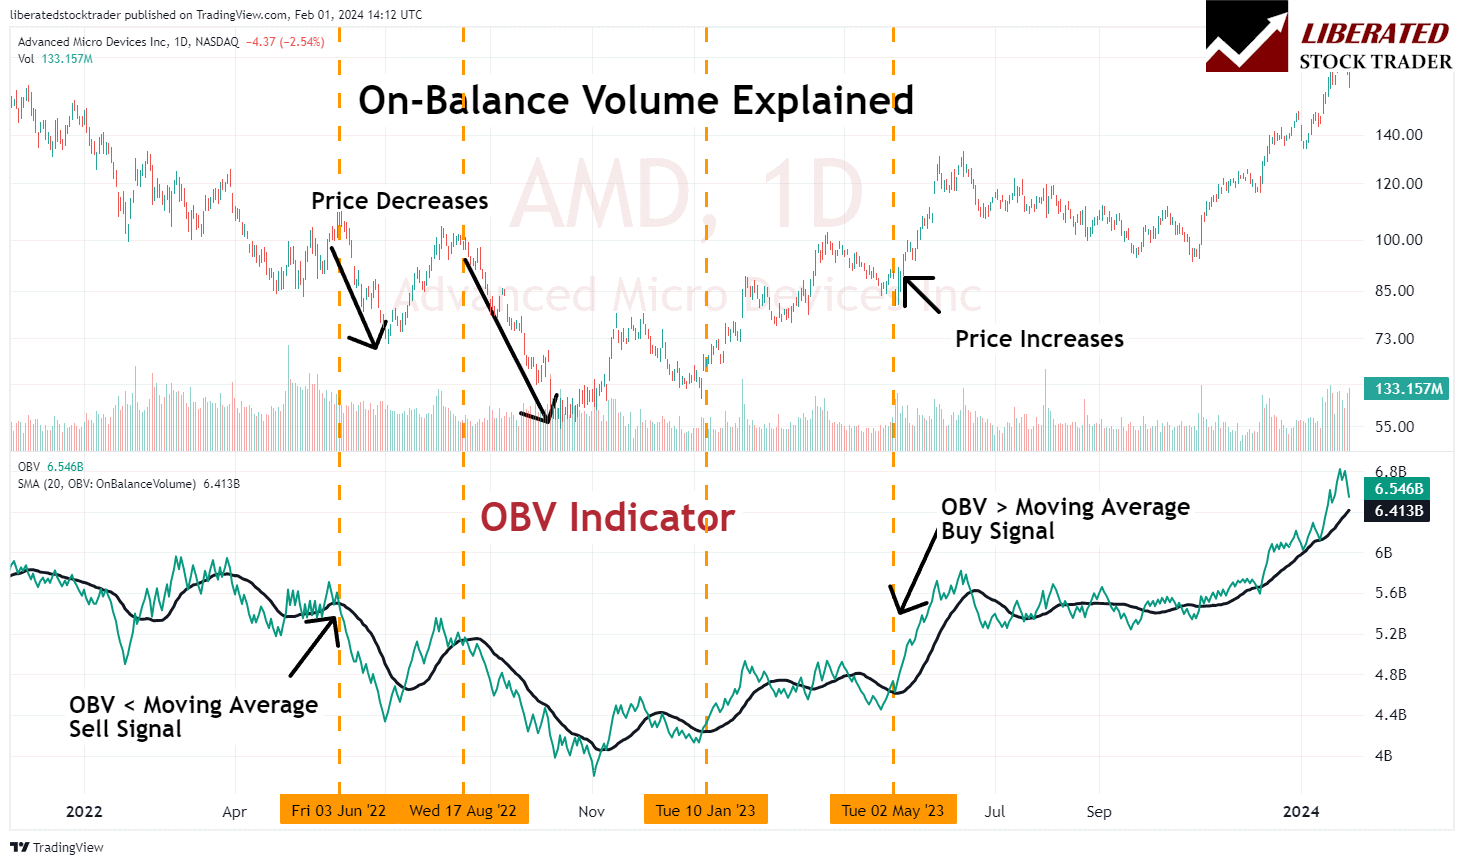
On-balance volume (OBV) is a cumulative indicator in technical analysis designed to show the volume flow relative to a security's price movements. The OBV reflects the collective buying and selling pressure crystallized through the volume trend.| Liberated Stock Trader
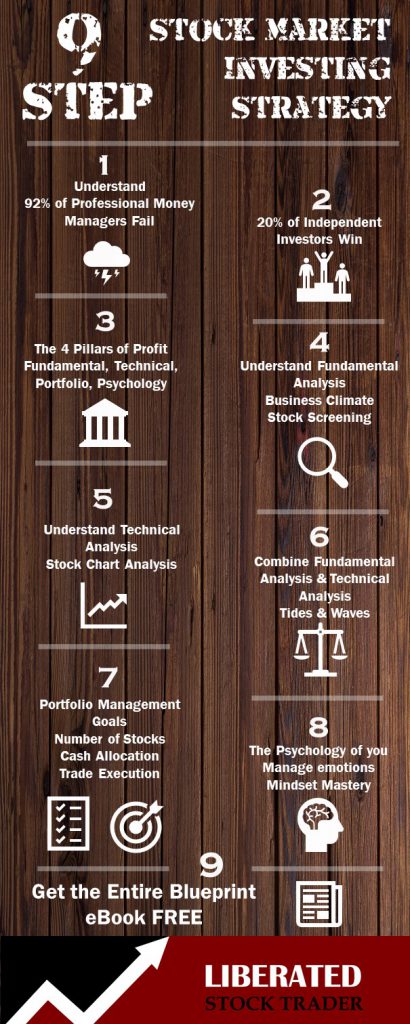
The stock market strategy blueprint is a handcrafted process to help you to understand all the factors at play in the stock market.| Liberated Stock Trader
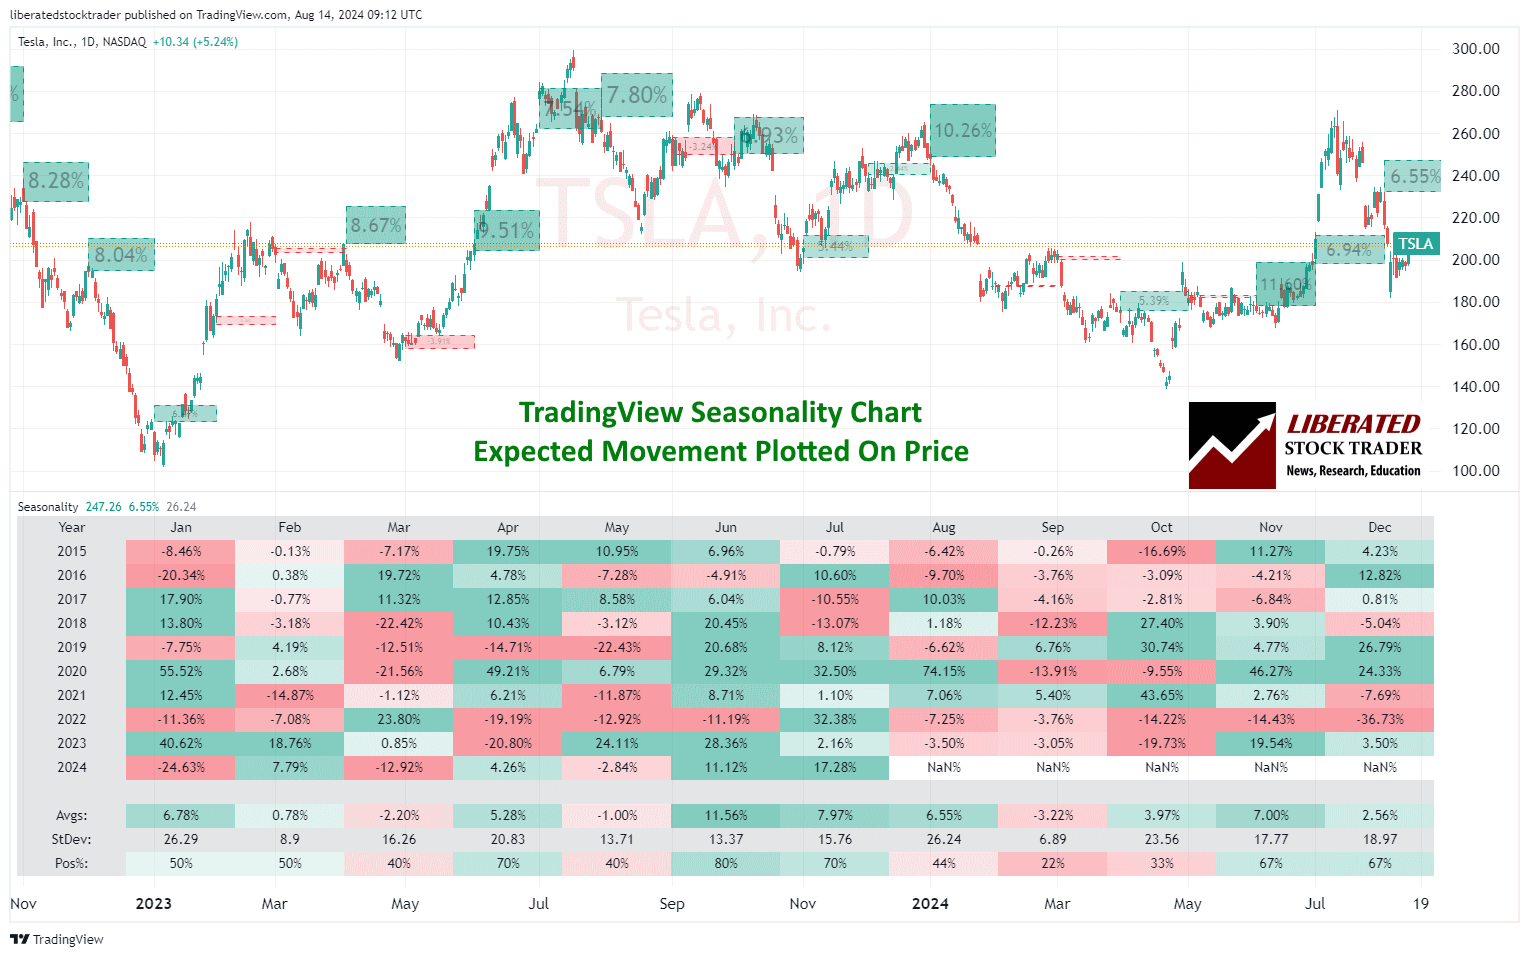
Seasonality charts provide predictable patterns that stocks follow during specific days, weeks, and months of the year. These trends are influenced by recurring events or cycles.| Liberated Stock Trader
Stock futures are derivative contracts that track the future price of a certain stock. They are agreements to buy or sell a specific stock at a predetermined price on a set date in the future.| Liberated Stock Trader
To trade stock options successfully, you should have a strong foundation in basic stock market knowledge and an understanding of how options work. Options are contracts that give the buyer the right, but not the obligation, to buy or sell a specific stock at a predetermined price on or before a certain date.| Liberated Stock Trader
A stock option is a contract that gives the holder the right, but not the obligation, to buy or sell a security at a specific price within a specific time frame.| Liberated Stock Trader
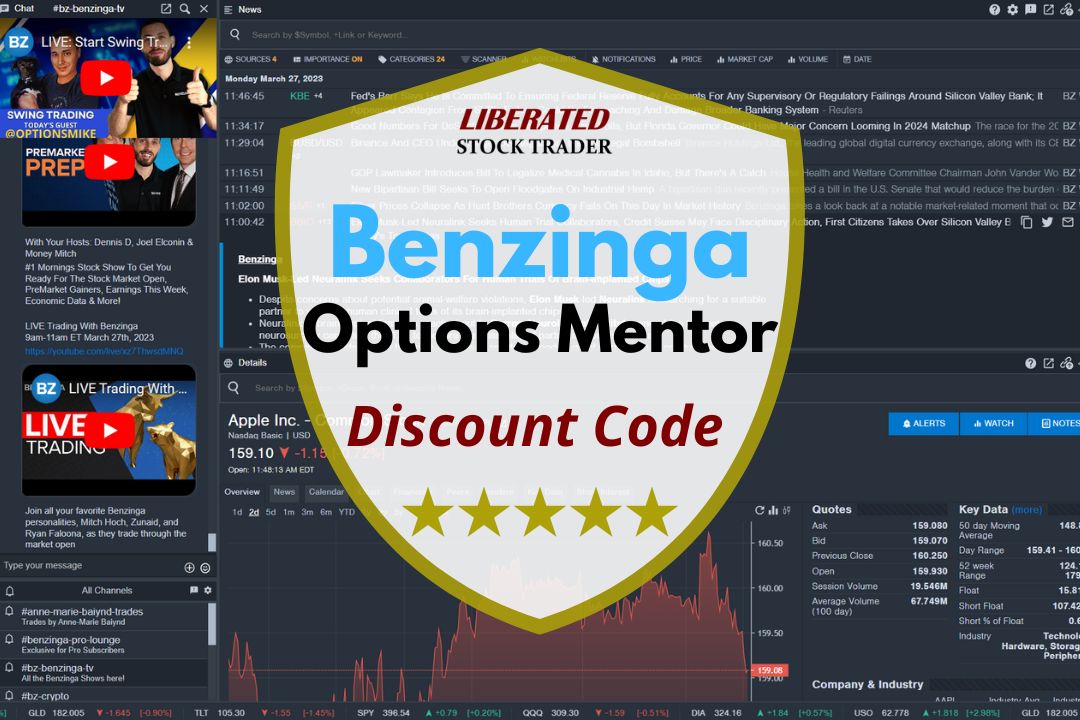
As a verified Benzinga Options Mentor partner, we offer a 25% discount. Add code "SMARTER" to the annual subscription for a 37% total discount, saving you $1,100.| Liberated Stock Trader
A penny doubled for 30 days will grow into over $5.3 million, or $5,368,709.12. Doubling your penny for 36 days makes you the world's richest person with $343 billion.| Liberated Stock Trader
Value investing is an investment strategy focused on buying stocks trading at a discount relative to their intrinsic or fair value. Academic research shows value investing generates lower risk and higher long-term returns than dividend and growth investing.| Liberated Stock Trader
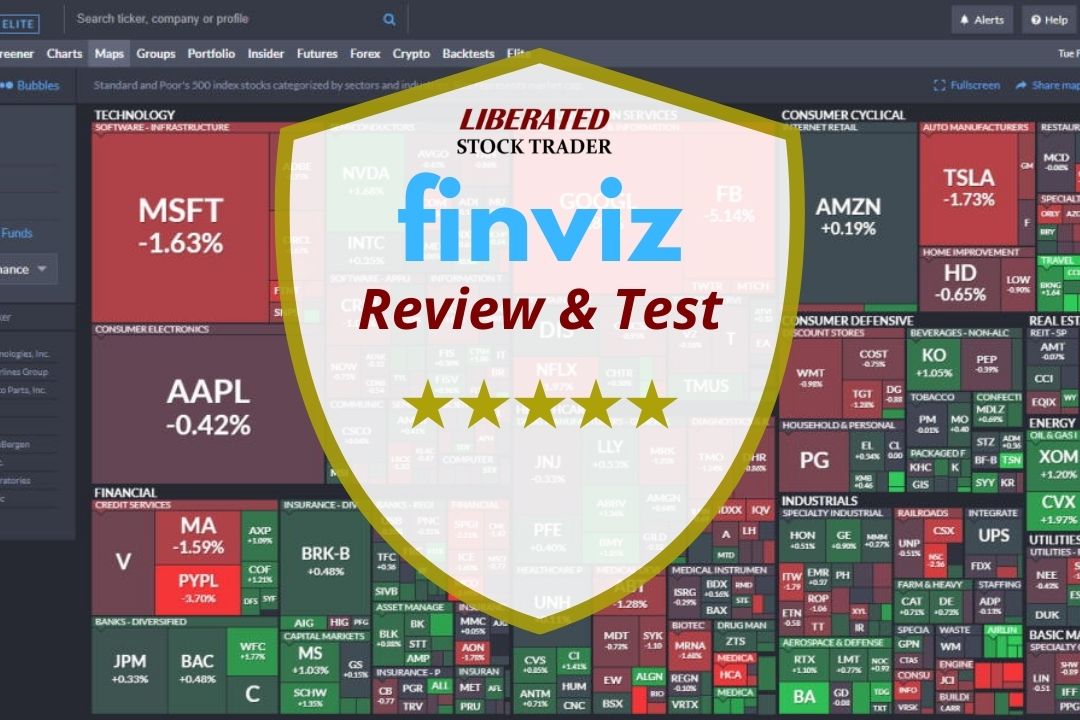
After hands-on testing, I found Finviz to be a powerful free stock screener, swift market heatmaps and impressive stock chart pattern recognition.| Liberated Stock Trader
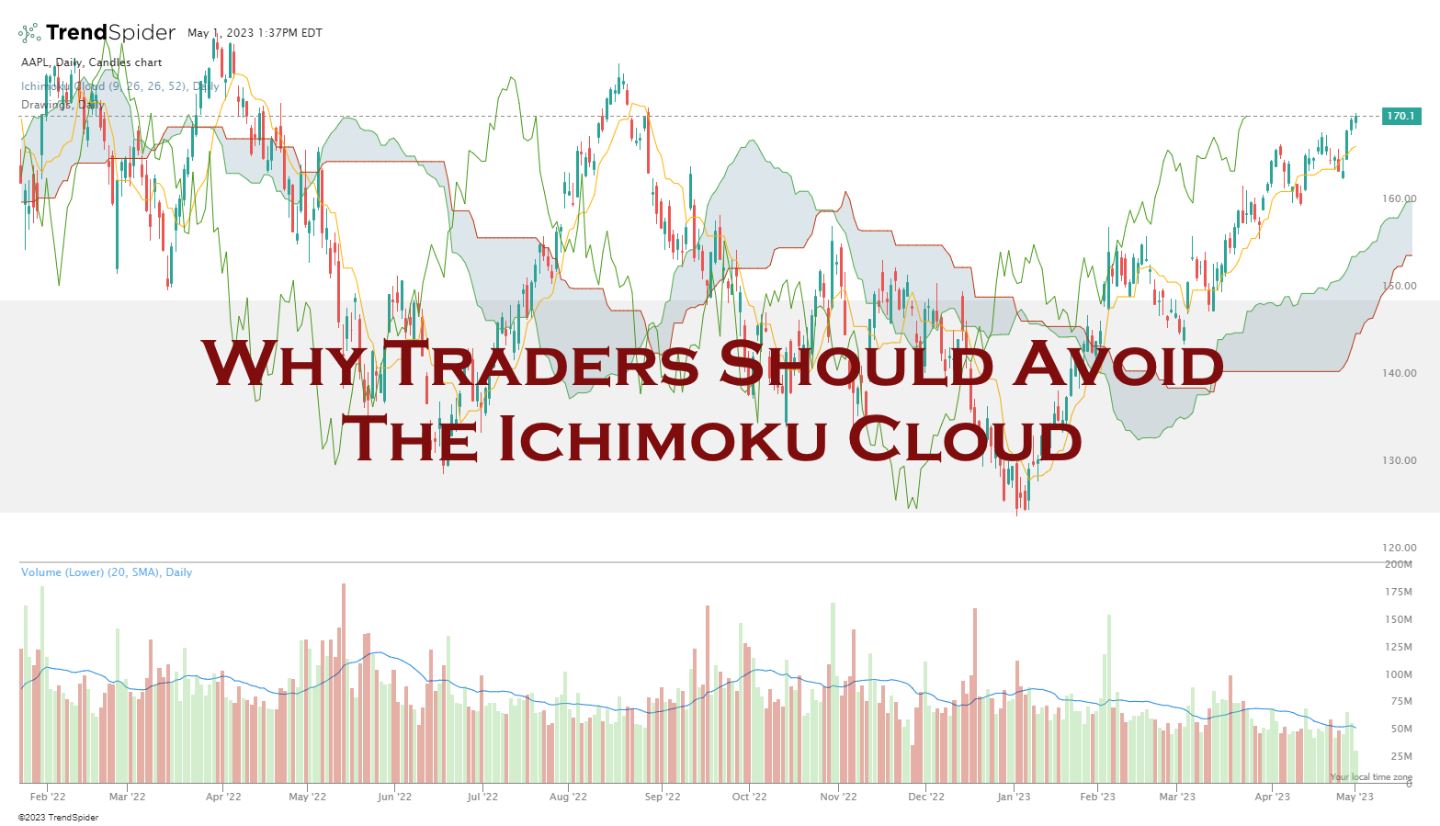
The Ichimoku test results are a dismal 10% win rate, underperforming a buy-and-hold strategy 90% of the time. The Ichimoku indicator is a poor choice for traders.| Liberated Stock Trader
A well-diversified stock portfolio should have a low correlation to the broader market. This means that your portfolio won't necessarily follow suit when the broad market goes down.| Liberated Stock Trader
ETF tax efficiency, liquidity, and low costs are perfect for independent investors. If you want someone to manage your money then mutual funds.| Liberated Stock Trader
A bond is an agreement between an issuer, usually a corporation or a government and a holder usually a commercial institution, individual or another government.| Liberated Stock Trader
Buying and selling currency in Forex trading is for advanced speculators. Because currency fluctuations are so small, a margin is required, making it a volatile and highly risky endeavor.| Liberated Stock Trader
I conducted 4,052 backtested trades using 307 years of exchange data to determine if the Supertrend is super! The Supertrend indicator is not profitable for swing traders using a standard daily candlestick/OHLC chart. It achieved a 43% win rate, with an average win of 7.8%.| Liberated Stock Trader
My test trades yielded a 1.77 reward-to-risk ratio, with an average winning trade of 8.5%. Across a large sample, an ATR-based strategy yielded a small gain per trade, but it lost more often than it won and experienced significant drawdowns.| Liberated Stock Trader
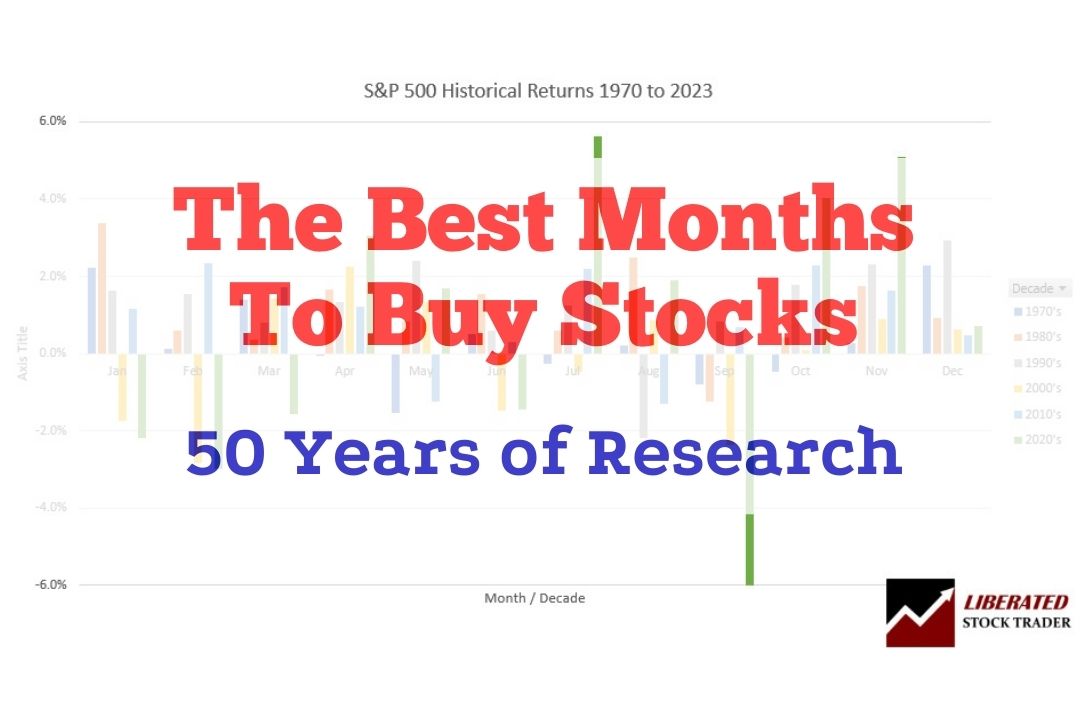
According to our research, using 53 years of stock exchange data, the best time to buy stocks is in October, and the best time to sell stocks is in July.| Liberated Stock Trader
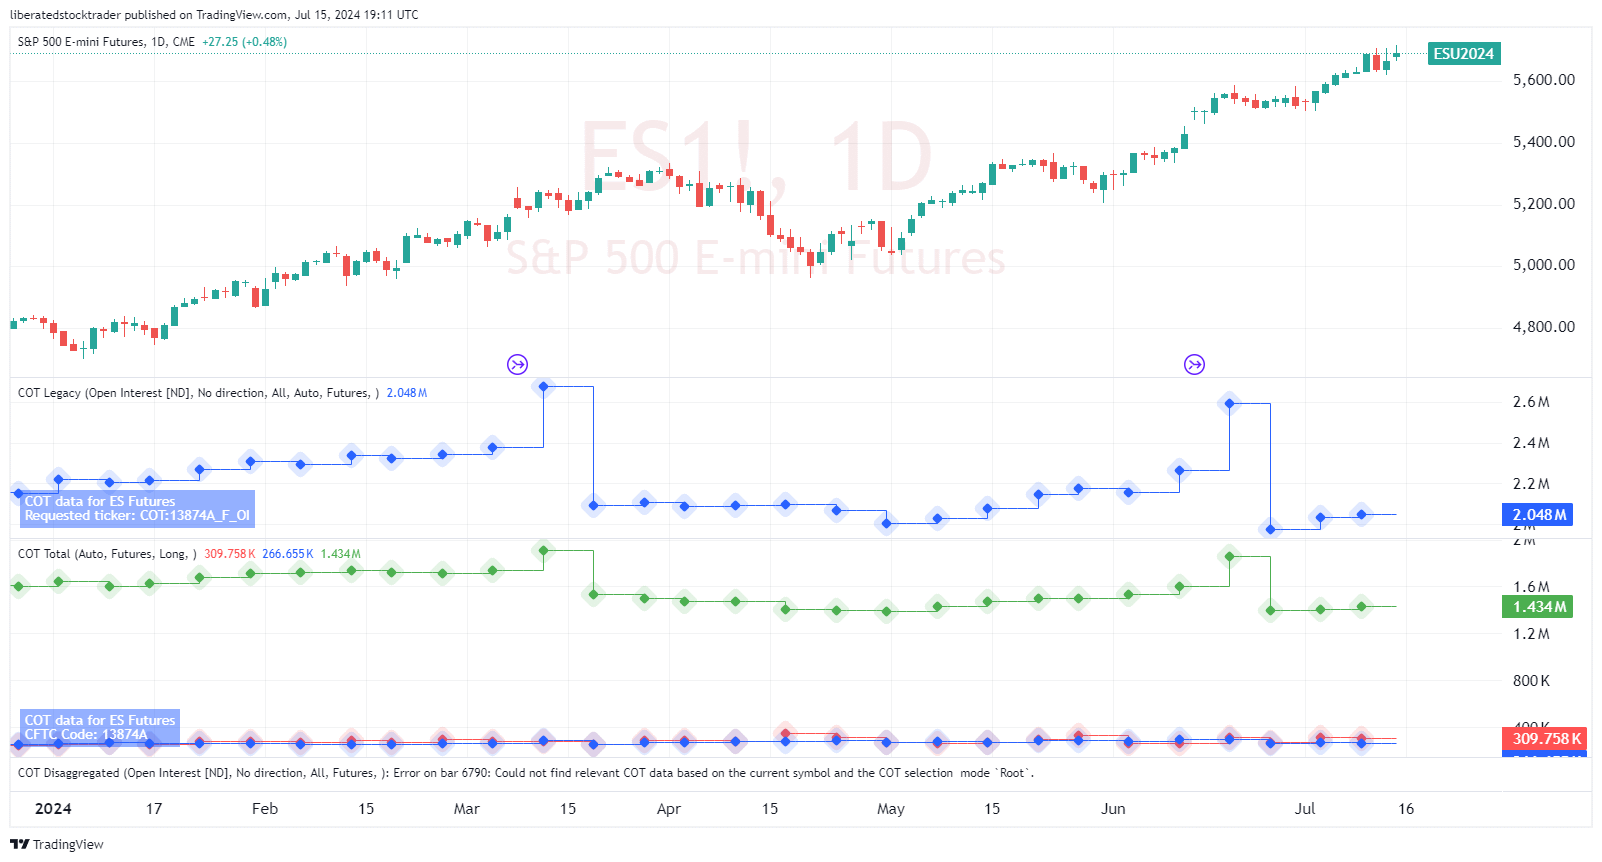
The Futures Market is where individuals and institutions buy and sell contracts to deliver a commodity, currency, or security at an agreed-upon time. These contracts are standardized for quality, quantity, delivery dates, and settlement terms.| Liberated Stock Trader
The Commitment of Traders (COT) Report is a valuable tool for traders wanting to understand market sentiment in the futures markets.| Liberated Stock Trader
TradingView scores 4.8/5.0 because it does everything well, and Finviz scores 4.3/5.0 because it lacks a community, live trading, and has inferior charts. However, Finviz excels at rapidly visualizing vast stock market data on a single screen.| Liberated Stock Trader
Our comparative testing of TradingView vs. Stockcharts shows TradingView is a powerful global stock charting platform with 13 million active users, compared to StockCharts.com, which has expert commentary but only covers US markets.| Liberated Stock Trader
TradingView's depth of features is the key difference versus TC2000. TC2000 offers powerful charts, scanning, and stock and options trading in the USA. But TradingView enables charting, screening, backtesting, and trading stocks, forex, futures, and crypto globally.| Liberated Stock Trader
My testing of TradingView vs. TrendSpider reveals that TrendSpider is best for AI-automated pattern recognition, scanning, backtesting, and auto-trading.| Liberated Stock Trader
Kagi charts provide traders with a unique perspective on price action, filtering out much of the noise and highlighting genuine trends. Getting a handle on how to use Kagi charts, dialing in the right settings, and understanding how they compare to other chart types can really sharpen your technical analysis and trading decisions.| Liberated Stock Trader
Seasonal trends refer to certain sectors, like retail, which often perform better during holiday seasons, while agricultural products might see spikes during harvest times.| Liberated Stock Trader
According to my research, during a bull market, investors should hold a stock for between 50 and 300 days to allow profits to develop optimally. The ideal hold time for swing traders is 45 days for an average profit of 30%.| Liberated Stock Trader
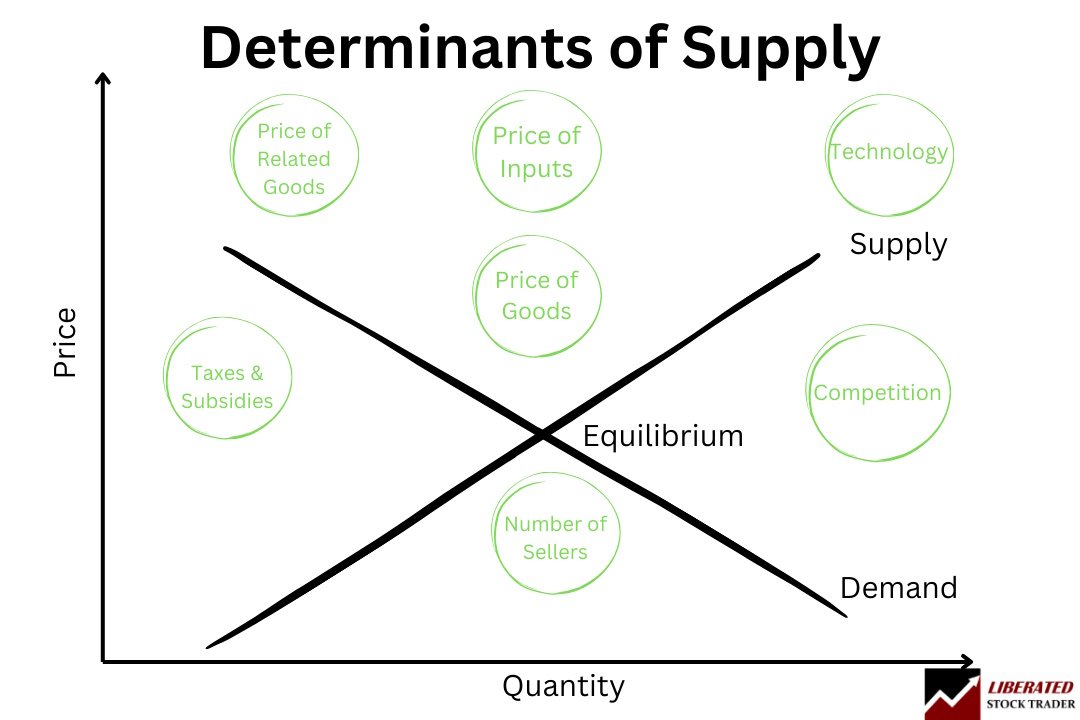
The determinants of supply are crucial in economics, forming the foundation of functioning markets and the economy. Key determinants of pricing, labor, taxes, competition, suppliers, and technology cause the supply of goods and services to change.| Liberated Stock Trader
The Long-term debt ratio is a financial metric investors use to assess a company's use of long-term debt for financing its operations. A high long-term debt ratio over 25% indicates a higher investing risk, whereas a low ratio indicates a company is in better financial shape.| Liberated Stock Trader
The best CANSLIM stock screeners to accurately find growth stocks are Stock Rover for US investors and TradingView for international traders. Stock Rover has 3 pre-built CANSLIM screeners, and one is available for free.| Liberated Stock Trader
My testing shows the best TradingView indicators for advanced analysis are Volume Profile HD, VWAP, Supertrend, ATR, Relative Volatility, and RSI. TradingView's candlestick and chart pattern recognition algorithms are game changers for improving trading outcomes.| Liberated Stock Trader
To consistently beat the market is difficult but not impossible. O'Neill, Greenblatt, Buffett, and Klarman are legendary investors who have beaten the market. I test the strategies and show you the best ways to implement them.| Liberated Stock Trader
We explain the 101 most important stock market terms and decipher financial jargon with simple definitions and practical examples.| Liberated Stock Trader
Our testing shows that a high short-interest float greater than 20% and a short-interest ratio (days to cover) over 19 days are the keys to finding potentially explosive short-squeeze stocks.| Liberated Stock Trader
Short interest is the total number of outstanding shares sold short. Our data suggests short-sell traders should look for a high short interest float over 6% and a short interest ratio (coverage) greater than 19 days to find highly profitable short squeeze scenarios.| Liberated Stock Trader
There are two main types of stock: common stock and preferred stock. Common stock is the most basic form of stock and gives shareholders voting rights and a share in the profits or losses of the company.| Liberated Stock Trader
Yes, you can buy and sell the same stock on the same day four times weekly in the USA. If you day trade more often, you must follow the FINRA rules on Pattern Day Trading (PDT), which means being a registered day trader and having a $25K minimum account balance.| Liberated Stock Trader
The accounts payable turnover ratio quantifies how often a company pays off its suppliers within a specific period. To calculate it, one divides the total purchases made on credit by the average accounts payable for the same period.| Liberated Stock Trader
A hedge fund is an investment vehicle that pools capital from high-net-worth investors and flexibly invests in a range of assets, including stocks, bonds, commodities, and derivatives.| Liberated Stock Trader
Most stocks are considered liquid assets because they are traded on open exchanges. But not all stocks are liquid. Penny stocks trading on over-the-counter (OTC) exchanges can have few buyers and sellers, making them illiquid, high-risk investments.| Liberated Stock Trader
By allowing investors and analysts to measure the returns a company generates from its employed capital, ROCE serves as a magnifying glass over the business's operational effectiveness.| Liberated Stock Trader
A stock price represents a share of a company in the US, while the share price is more commonly used in the UK, Australia, and other parts of the world.| Liberated Stock Trader
To calculate dividend yield, divide the stock's annual dividend per share by the stock's current market price. The dividend yield increases as share prices drop, so to triple your yields, buy stock price panic crashes.| Liberated Stock Trader
Investing in growth stocks is a strategy that looks for fast earnings growth and growth in stock price. Growth stocks and strategies are covered in this section.| Liberated Stock Trader
Our step-by-step guide covers four dividend strategies: high yield, safe dividends, long-term dividend growth, and dividend value stocks. It also shows you the tools and screening criteria you need to find high-quality dividend stocks.| Liberated Stock Trader