We teamed up with Miska Knapek to transcribe our 170 episodes into full written text — resulting in 1,539,957 spoken words overall, including 61 mentions of weather, 923 mentions of maps and 48 men…| Data Stories
Data design systems and styleguides are currently a huge trend in the data design world. Moritz is joined by Gabrielle Mérite and Alan Wilson and together we exchange experiences in this emerging space, from designing dataviz components as part of Adobe Spectrum, the styleguide for Deloitte’s Insights Magazine or the WHO Data Design Language. Gabriele also wrote about adding touches of ethical guidance in guidelines in one of her recent newsletters. Enjoy!| Data Stories
We have Vidya Setlur on the show to talk about the role language, and natural language processing (NLP) play in data visualization and analytics.| Data Stories
Finally, this year we managed to record another classic episode from the IEEE VIS Conference (we recorded a total of 10 with this one!) We have Data Stories’ friend Prof. Tamara Munzner with us to talk about the conference and to highlight a few things she picked from the many events that happened over this week-long event.| Data Stories
In this new episode, we talk about the interplay between statistics and data visualization. We do that with Andrew Gelman, Professor of Statistics and Political Science at Columbia University, and Jessica Hullman, Professor of Computer Science at Northwestern University. Andrew started the popular blog “Statistical Modeling, Causal Inference, and Social Science,” which has an active community of readers and has been around for many years. Jessica started contributing lately with many exci...| Data Stories
Visualization is a very powerful cognitive tool. I think we all agree with that. But what happens if a person is visually impaired or has other impairments that prevent them to fully benefit from it? It’s surprising, despite the huge success visualization had during these last few years, how little we have to show in terms of supporting this very relevant segment of the population.| Data Stories
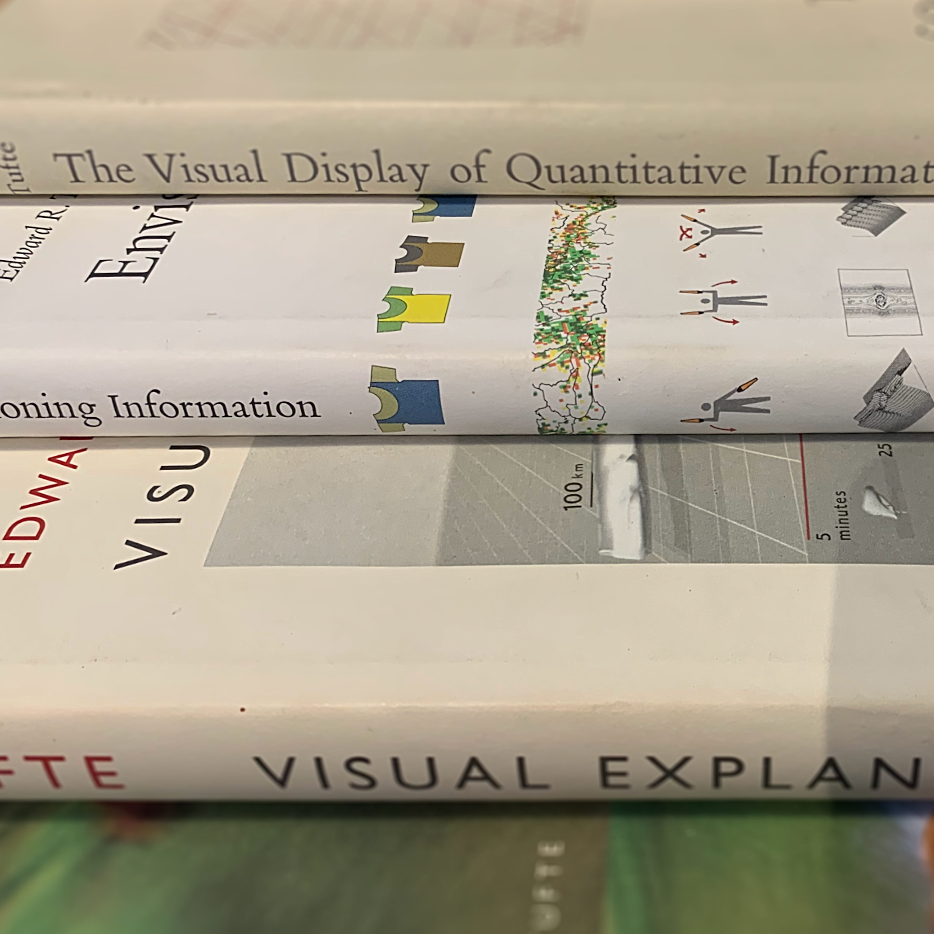
We have our friend Sandra Rendgen on the show to talk about the work of Edward Tufte. Tufte does not need any introductions of course. We discuss his early works and efforts, all the books he published, his contribution and legacy and the influence he had on our work.| Data Stories
This week, we are joined by Amelia Wattenberger, journalist-engineer at the Pudding and book author. We discuss the exciting Svelte framework for web development, which is especially well suited for developing interactive data visualizations. Hear how it compares to other frameworks like react, why web development nowadays seems so complicated, and finally, hear a few ideas for last minute dataviz-related present ideas for the holiday season 🙂| Data Stories
Hey all, we are back! In this classic episode we go over highlights from the IEEE VIS’20 conference. We cover a broad set of themes with Danielle Szafir from University of Colorado and Miriah Meyer from University of Utah, who helped us explore latest trends in visualization. See the main links and details in the show notes below. There is a lot to explore!| Data Stories