We have overhauled our original menu in ET1.1 to improve the adoption of the software and ease of usage. We’ve completely redesigned the node menu to now be a source of knowledge. The Training Menu in ET1 makes learning about data transformation tools faster, attaches to the training built into dev3lop, and is more intuitive […] The post ET1.1 Training Menu Update appeared first on Dev3lop.| Dev3lop
Never have I ever tried to reverse engineer figjam! However once I was done, I realized there’s a lot more within my grasp. Hey everyone, ET1.1 has come a long way, we have a free ETL version of ET1 that’s available online, plus ET1 code on github (very trendy) and everything is created by me, […] The post ET1.1 Change Log | Version #1 appeared first on Dev3lop.| Dev3lop
In ET1.1 Neon you can now pipeline your data to Charts. This covers an array of classic data visualizations and the same highlighting functionally flows through from data grid to charts. Making it the first ETL software that help you see and understand your data between tools. Using graph tech, we can show you up […] The post ET1.1 Charts Node appeared first on Dev3lop.| Dev3lop
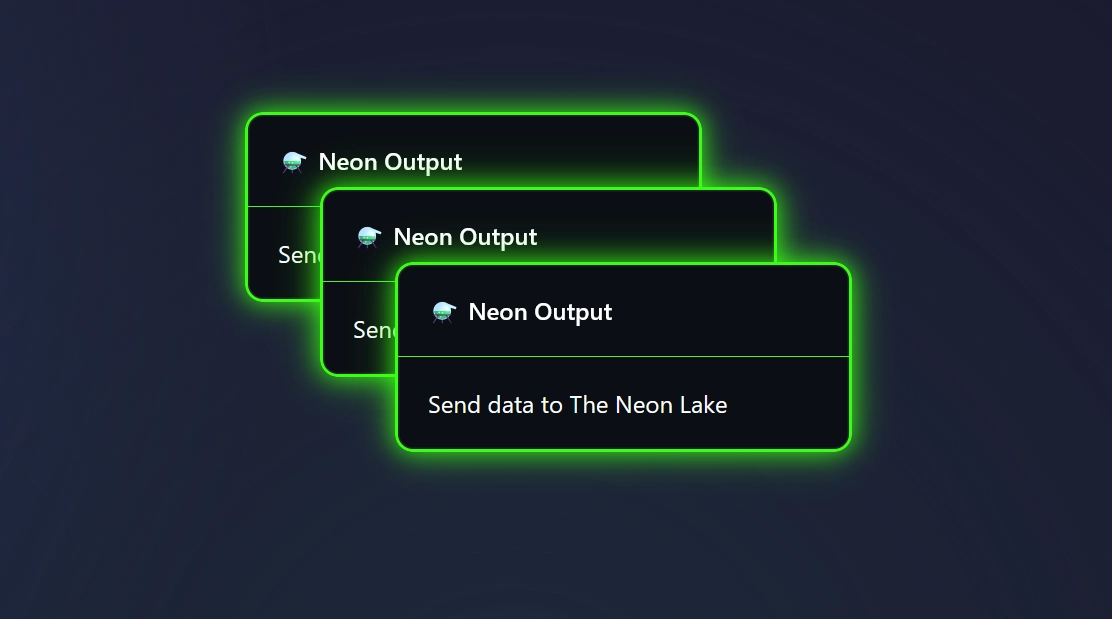
The Neon Output Node depends on serverless postgresql backend to ensure your data tooling thrives with cool features. Like unblocking postgresql’s upsert – built in an easy user experience. This Node syncs with your Data Lake, enabling users to gain data from any data in their Data Lake, from any workflow, and begin building their […]| Dev3lop
Picture a world where your most sensitive data files and database tables are protected with the same robust security protocols and layers you’d expect from a leading, Fortune 500 corporation. Without having to setup data security; login, authorization, storage, persistence, managing login information and keeping data compliance people happy. In ET1.1, we encourage end users […] The post Login to ET1.1 with Auth2 appeared first on Dev3lop.| Dev3lop
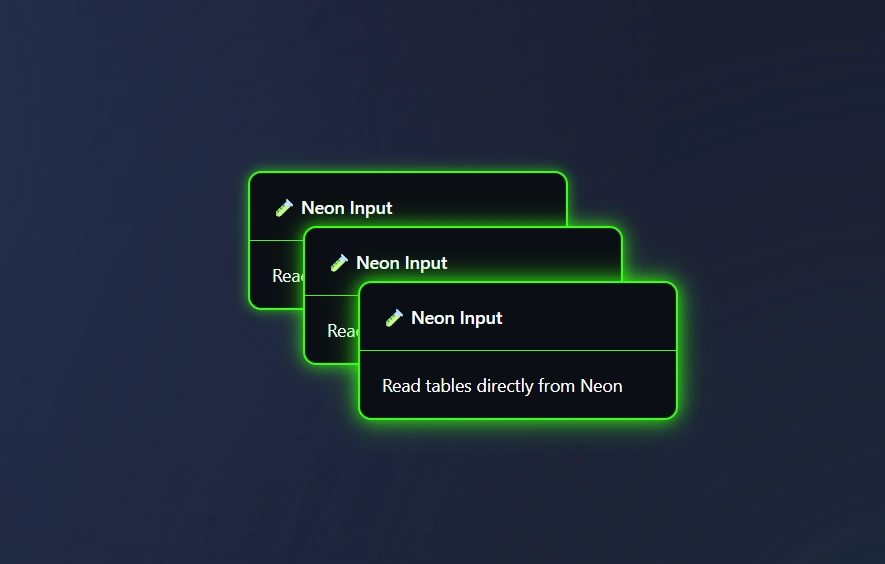
The Neon Input Node is our first managed database access node, and an intuitive approach to giving people access to a serverless PostgreSQL which users are able to manage in Neon Lake. Data here is safe, and protected by 0Auth (Two way authentication). As you use ET1.1 csv files, json, and manual tables, this data […]| Dev3lop
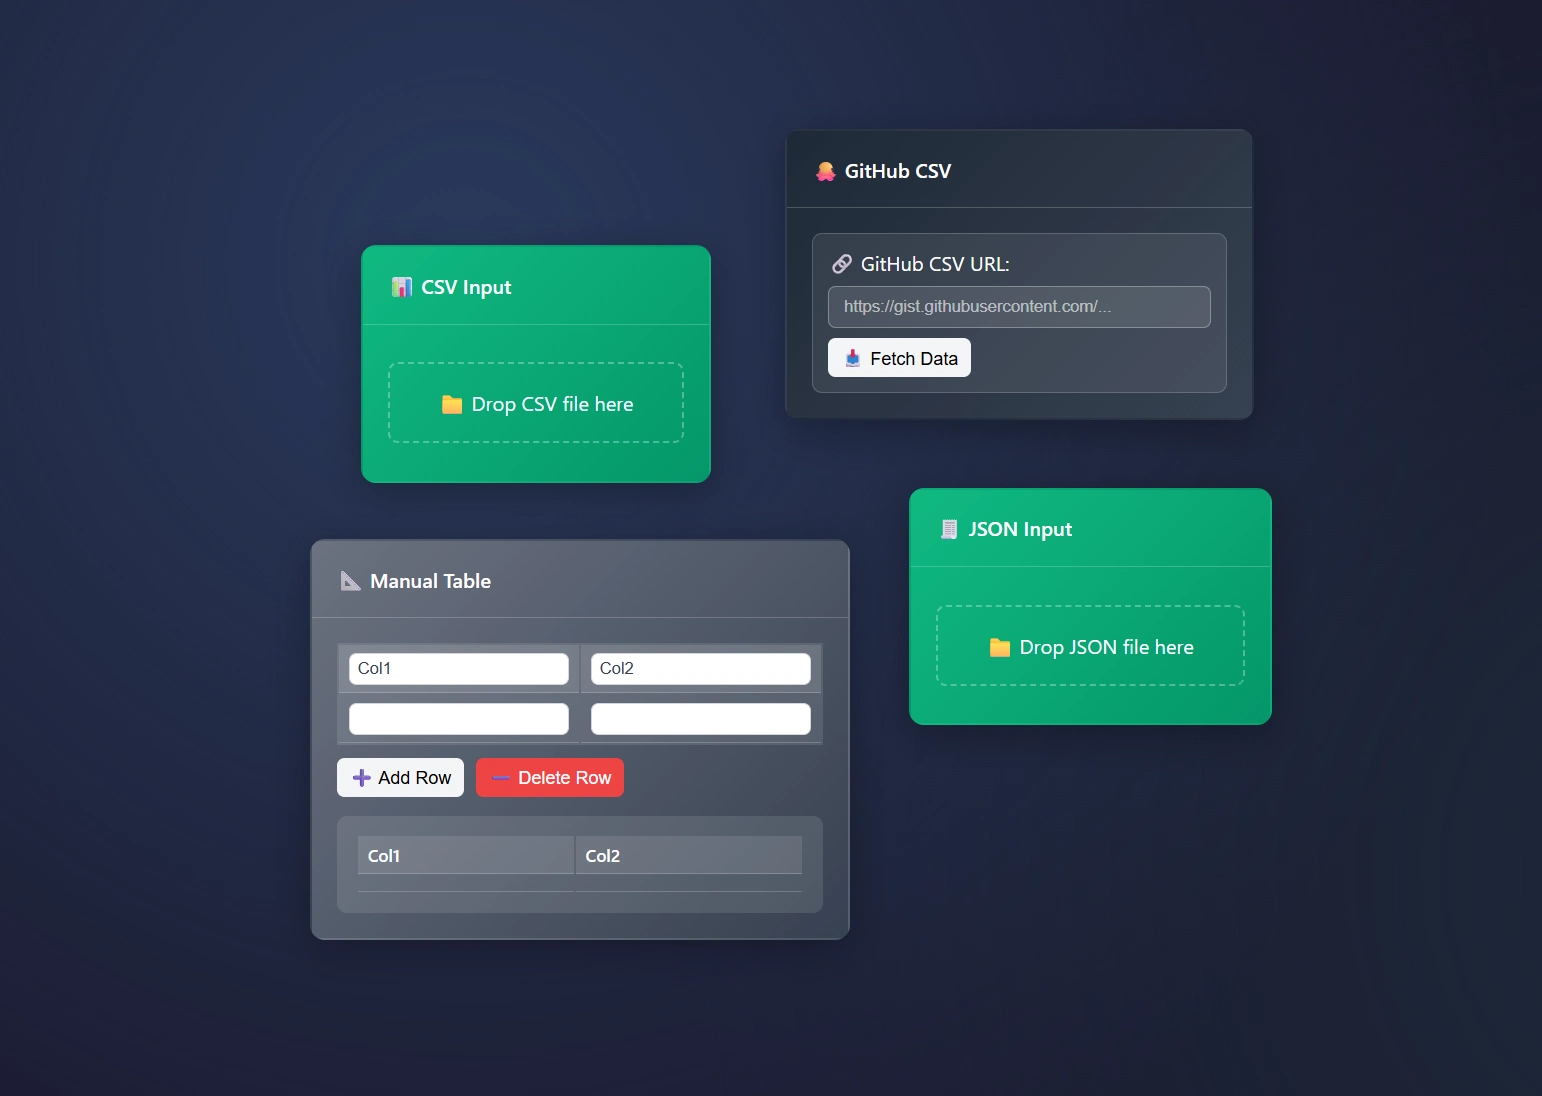
CSV, JSON, and Public CSV endpoints or manual tables. These help you kick start your data pipeline. Once your data comes into the data input, it begins to flow downstream using a custom DAG streaming engine. Input Node Overview The Input nodes are essential for moving the needle in ET1, without data, we are using […]| Dev3lop
The Constant Node creates a constant value per row in your data pipeline. This node is extremely handy when transforming data in your ETL processes. The Constant Node is rather straight forward, two inputs and you’re done. Using the Constant Node Add the Constant Node to your canvas, send data downstream to your node and […] The post ET1s Constant Node appeared first on Dev3lop.| Dev3lop
Bring your columns together as one with the Concat Node in ET1. This node is similar to concat() in Excel and allows you to easily bring more than 1 column together in your data pipeline, and also it gives you the ability to add the delimiter. The opposite of the Concat Node is the Split […] The post ET1’s Concat Node appeared first on Dev3lop.| Dev3lop
Automatically finding and replacing data is possible using the Find/Replace Node! Find and replace works inside of sentences, words, numbers, and anywhere in the data. Similar to “find all” and “replace all,” in your common Word Document software, ET1 offers the same but in a repeatable and consistent data app. Using Find/Replace Node Finding data […] The post ET1’s Find/Replace Node appeared first on Dev3lop.| Dev3lop
Create a table manually using the Manual Table Node. Manual Table node falls under the data input node category. Built to help you create small tables that you need to use in your data pipelines. When you need a thin layer of data, this is a great tool for manually synthesizing your data which happens […] The post ET1 Manual Table Node appeared first on Dev3lop.| Dev3lop
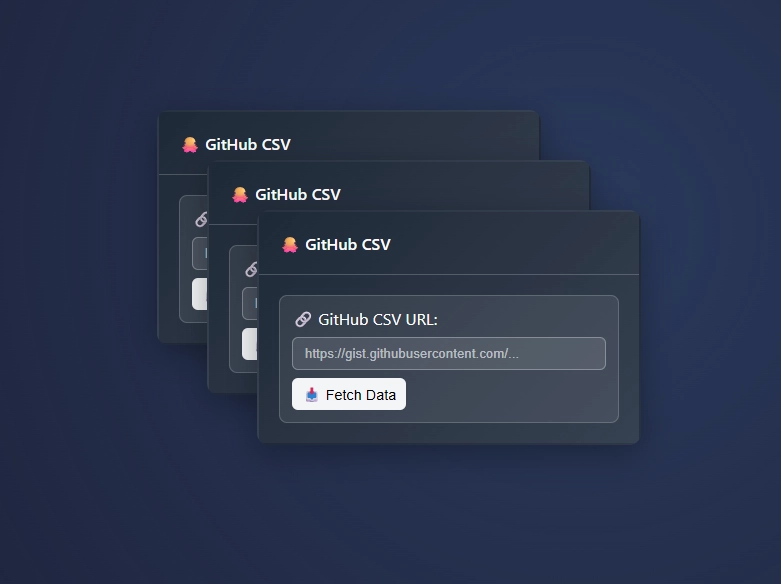
ET1’s Github CSV Node is designed to help end users extract data from Github CSV URLs which are in public repositories. A public repository on Github is not a place to put your private or company information. However City/State for USA is a commonly used resource in Map Data related solutions. Unlike the CSV Input […]| Dev3lop
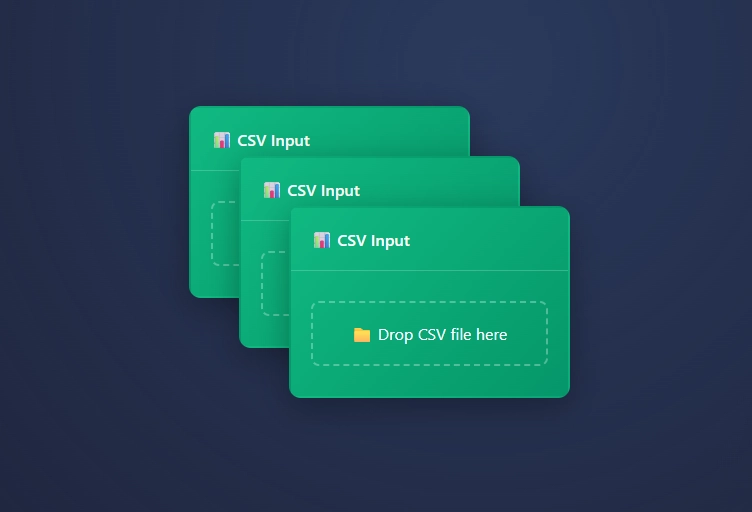
The CSV Input Node, what a classic, flat files living on your computer can be consumed and the data can be extracted here in ET1. CSV is a common file type for data gurus. Comma-Separated Values, a plain text file format for storing tabular data with values separated by commas. If you have a CSV […]| Dev3lop
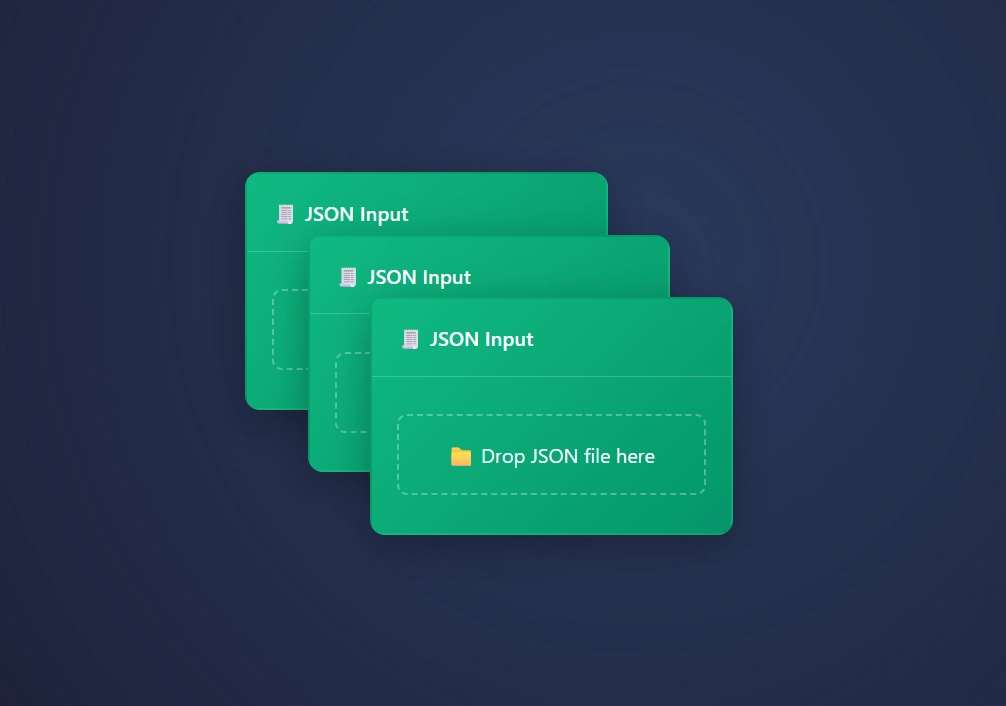
When extracting data from a JSON file, try the JSON Input Node. JSON (JavaScript Object Notation) is a common data source. With ET1’s JSON Input Node you can quickly open your JSON files and begin to transform the data, merge it with other data like offline CSV Node or online Github CSV data. In ET1, […]| Dev3lop
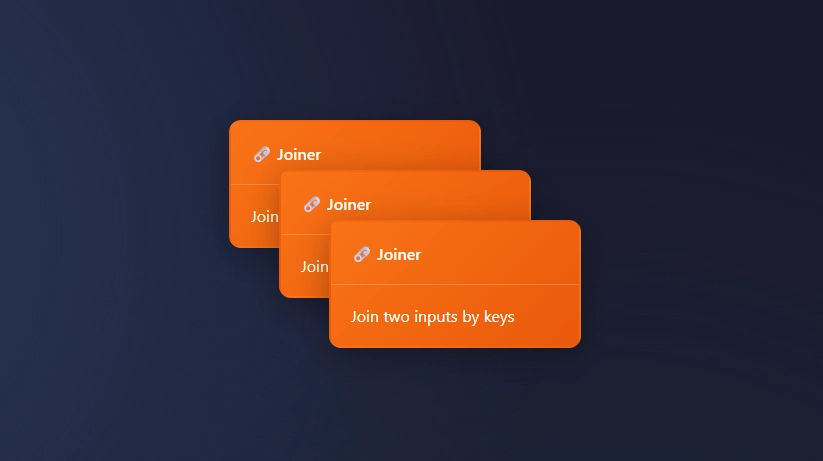
On your magic quest to join data? We call it the Joiner node. A simple joining solution that helps people join data at a row level. In ET1, Joiner is focused on “keeping it simple” and will aim to automatically infers your joins. ET1 assumes. Inferring a join means it assumes you prepared the data […]| Dev3lop
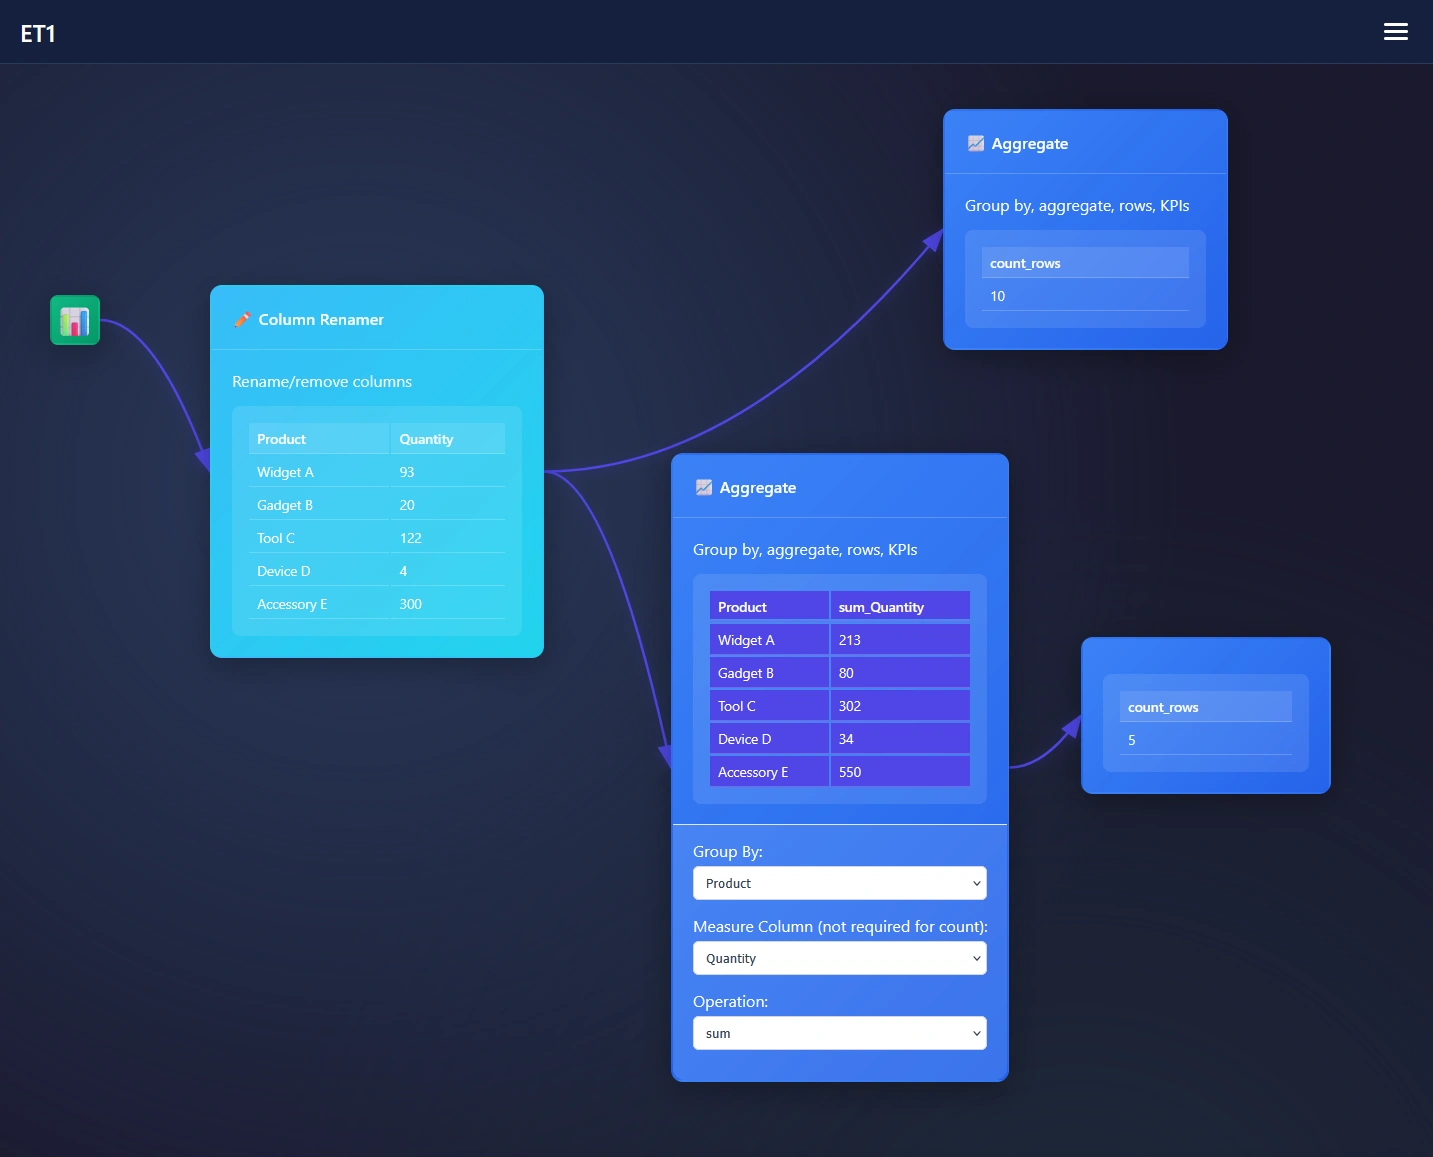
Eager to group data? The Group By feature can be found in the Aggregation Node. Add the aggregation node to the canvas and send data downstream to this node. We have many products, however duplicate quantities across many suppliers, and we need to check the quantity of entire business! Using Group By in ET1 Open […]| Dev3lop
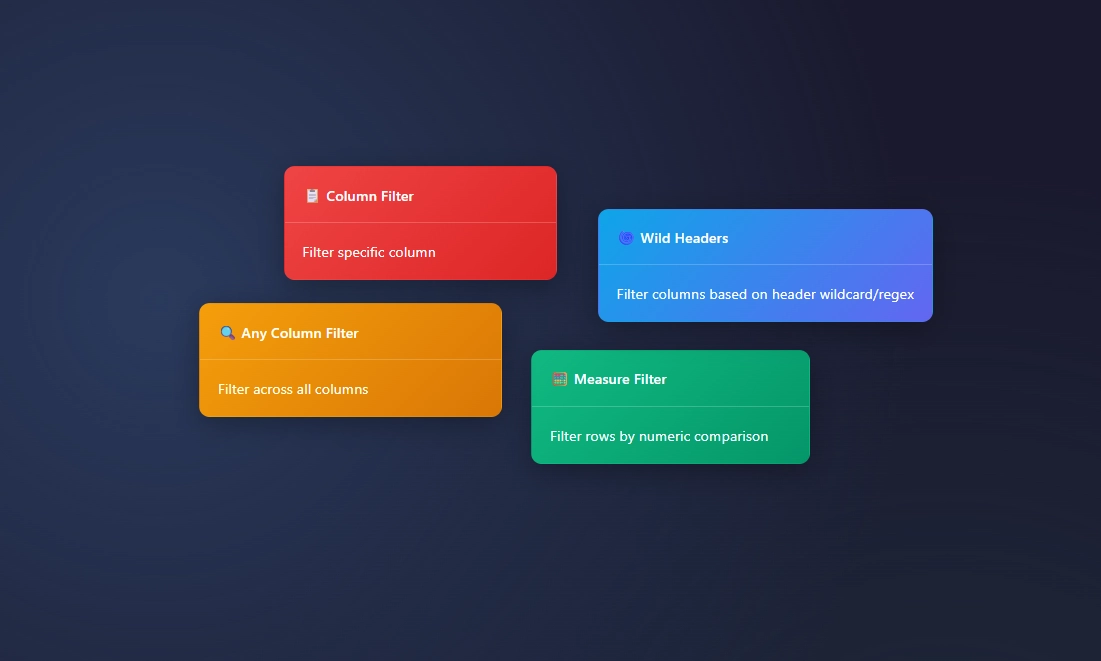
When you have numbers, you have a need for a Measure Filter Node. Numbers are here, lets talk about it. Filtering with a number or decimal is straight forward using ET1. Using Measure Filter Node in ET1 Get started using the Measure Filter node. Attach data pipeline / arrow. This flows data downstream. Then you […]| Dev3lop
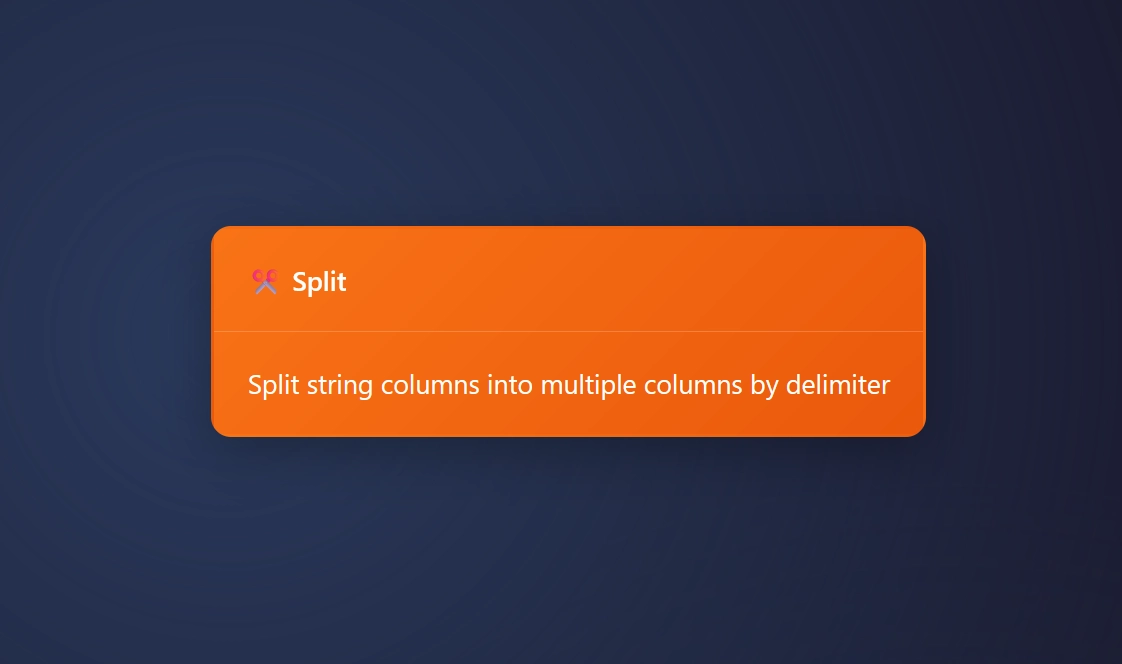
The Split node lets ET1 user split one or more column into multiple columns. This particular node is great for the times you have multiple rows of data with consistent delimiters. The data we are splitting Here is the CSV you need to follow the overview. We will pass this data through the CSV Input […]| Dev3lop
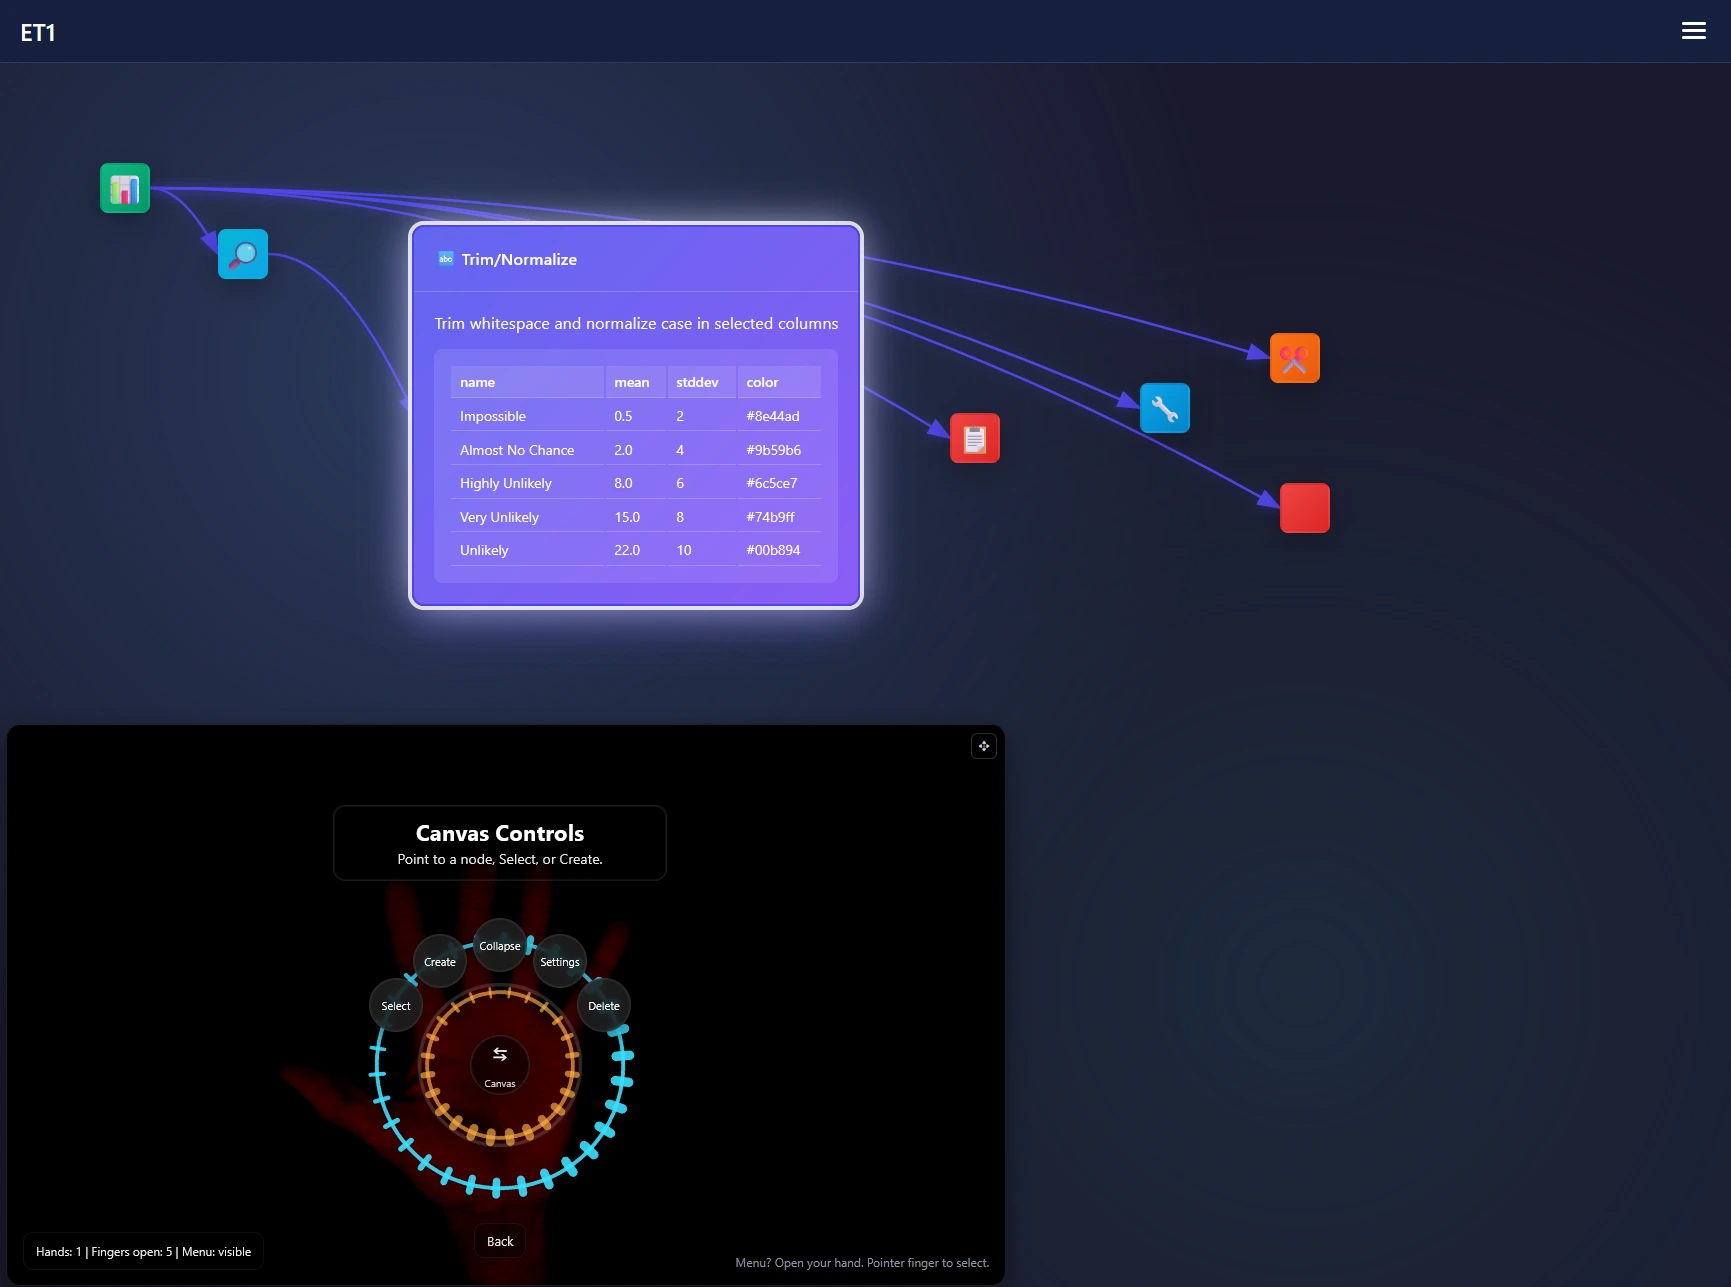
If a web-cam is available ET1’s code will try to automatically sync and if you can wave and point, this radial menu is a fun way to augment your ETL development. Using computer vision (explained in depth below) we map a skeleton over your hands and able to create a radial menu we are calling […]| Dev3lop
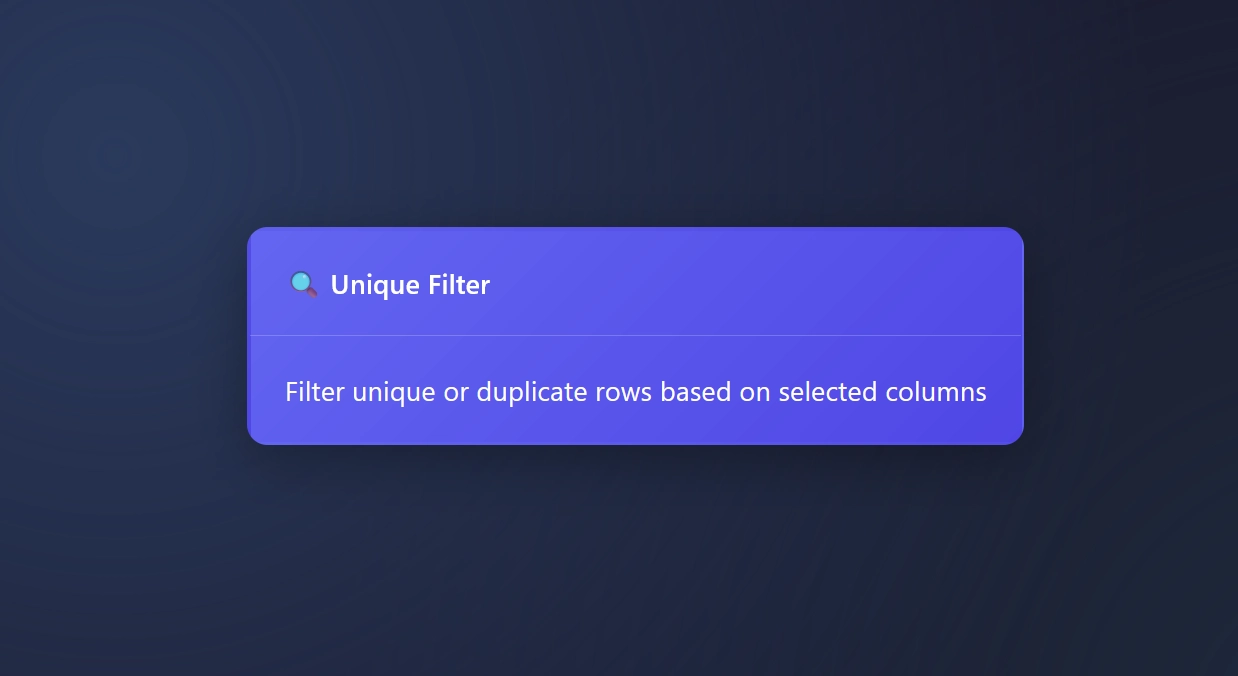
The Unique Filter Node or Unique Tool finds unique values per row in your data pipelines, or allows people to quickly review duplicates only. Plus, you can select what column(s) to find unique values within. This enables people to easily understand what is inside of a column. Duplicate rows happen, The Unique Filter node manages […]| Dev3lop
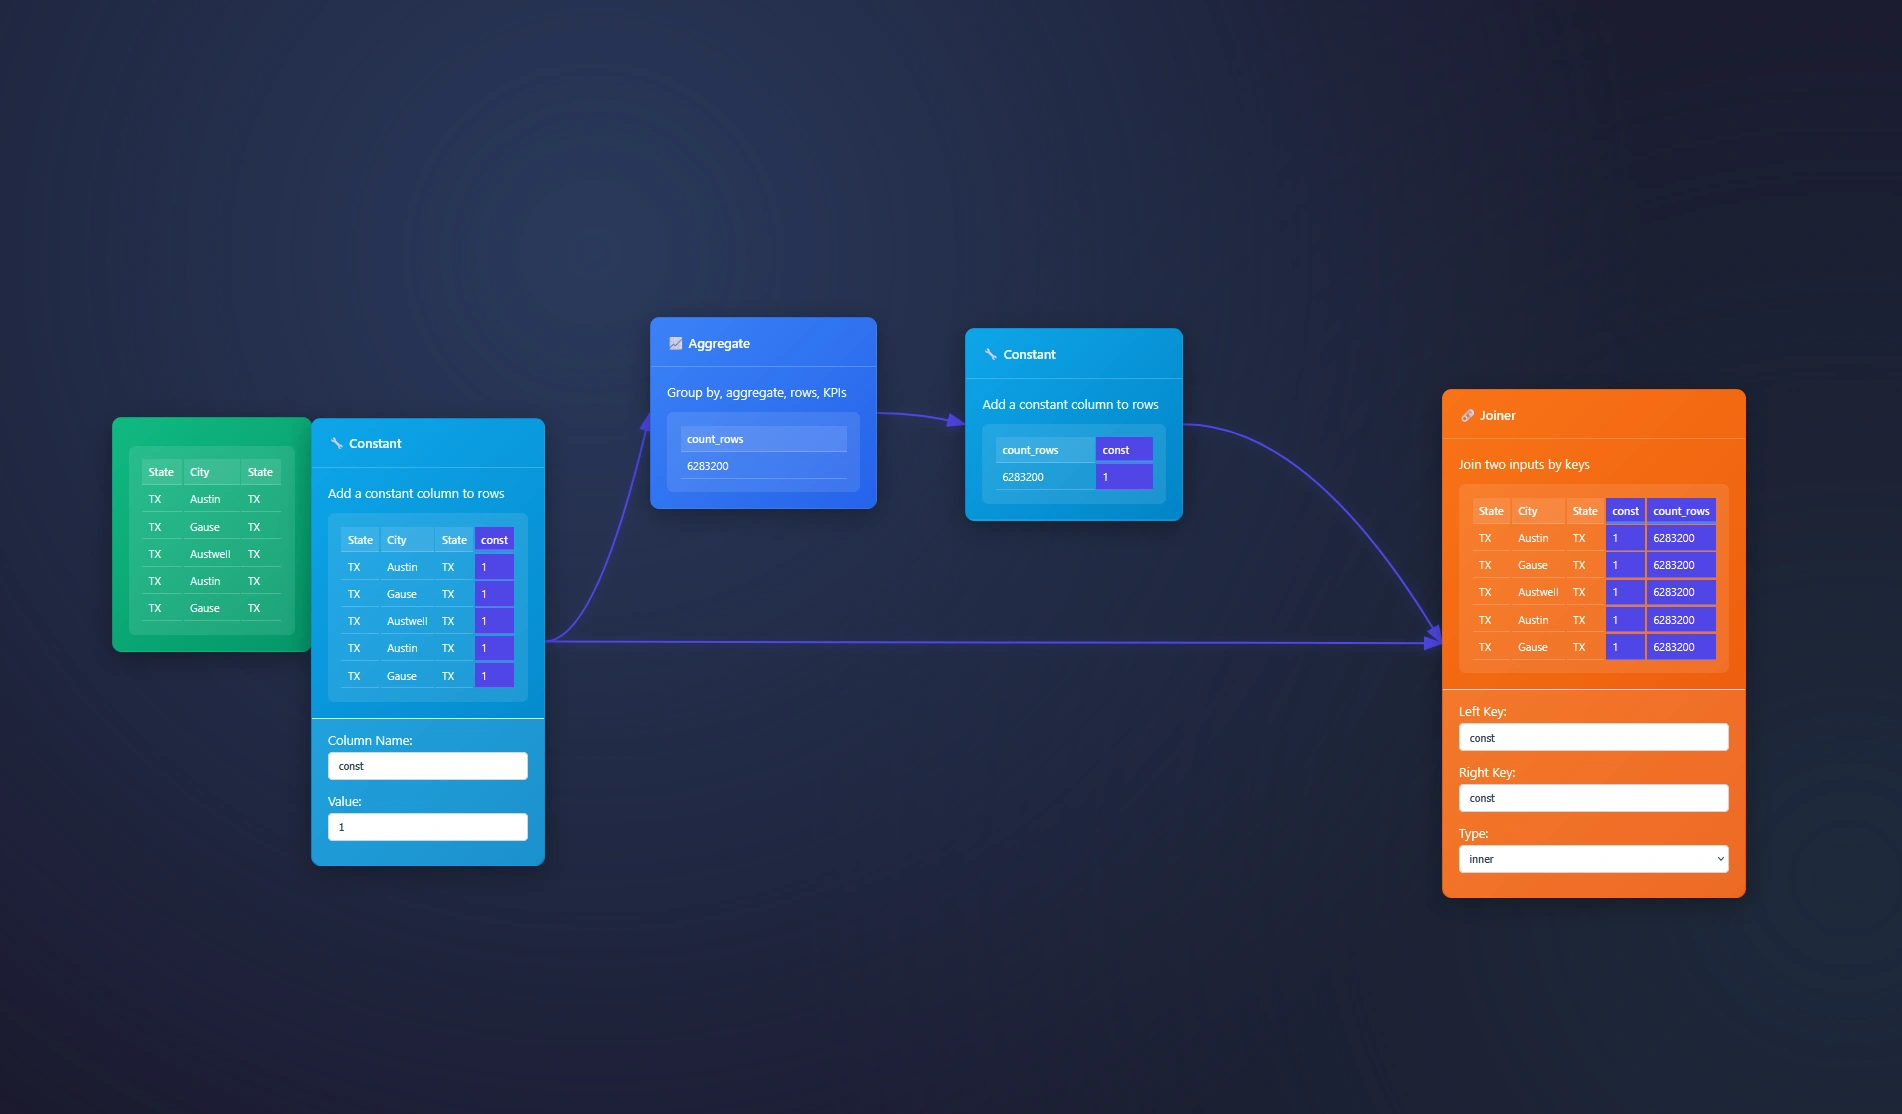
Seeking to append fields like the Alteryx Desktop software? The Joiner Node and Aggregate node is here to help. You will also need a constant to join on across both data streams. We will show you how in this example below where we are sent 6million records in a CSV and asked to append the […]| Dev3lop
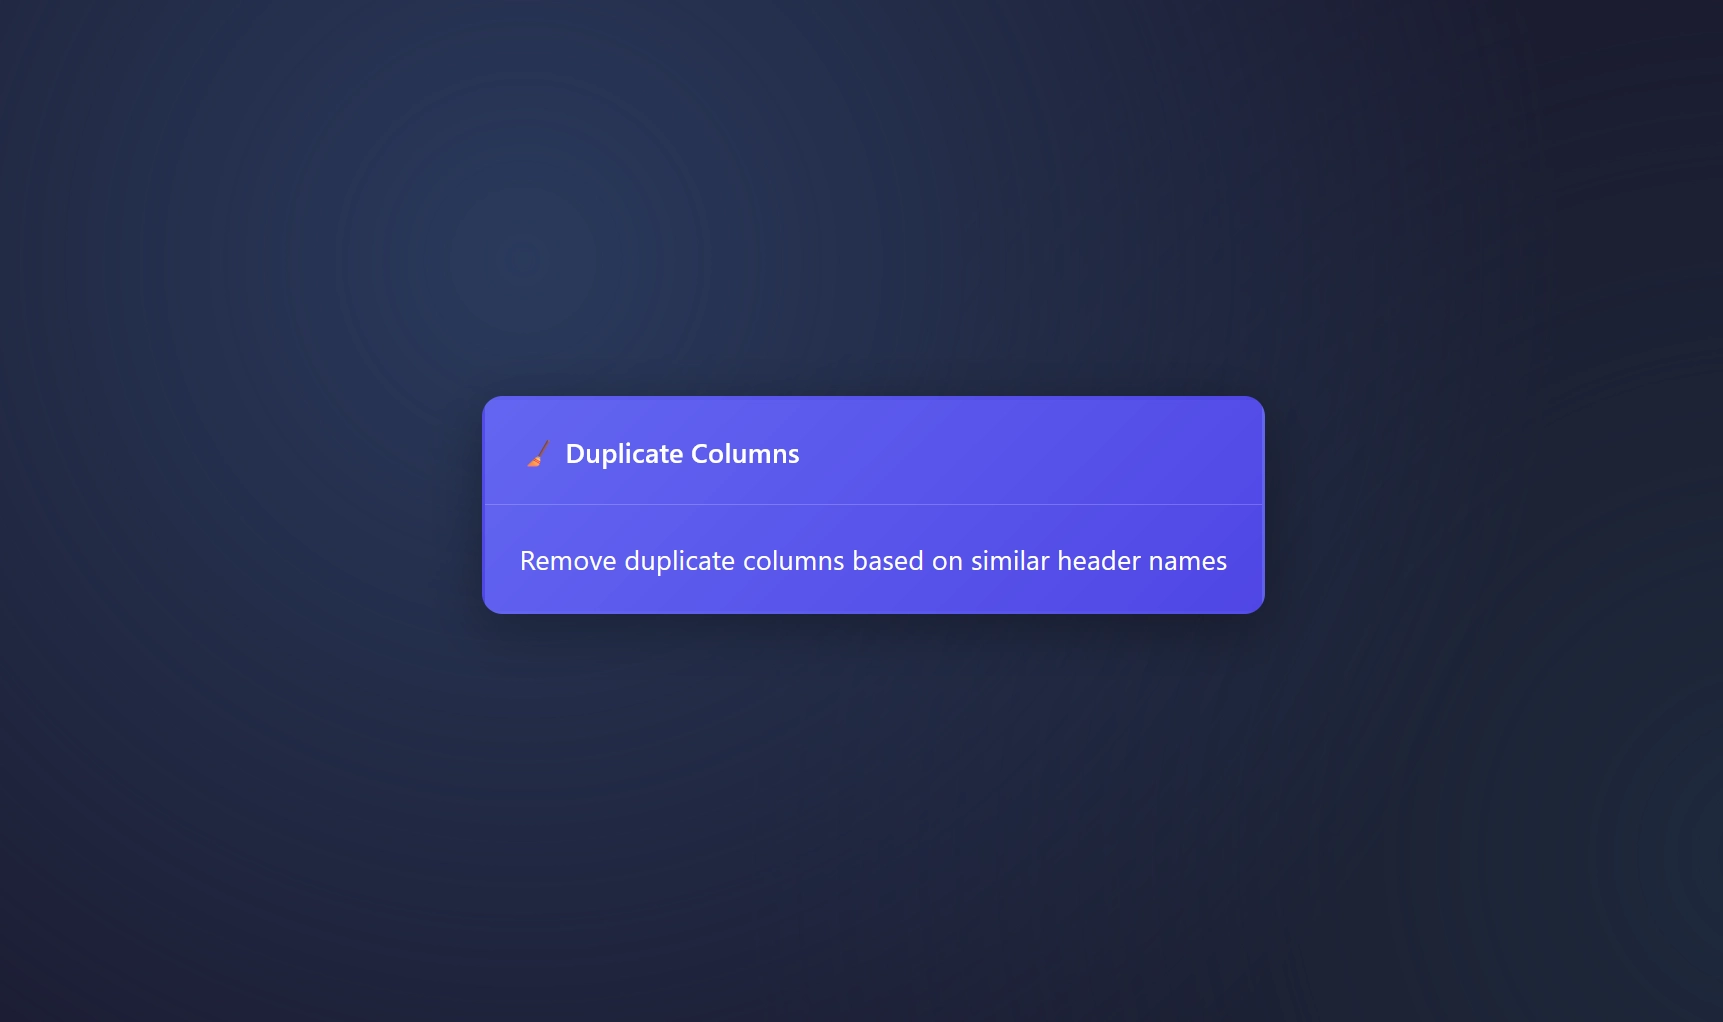
Dealing with duplicate columns? This particular node is designed to remove similarly named column headers. If “State”=”State” then we remove the last column and only keep the first column. “Remove duplicate columns based on similar header names” Currently there are no settings for this tool because today Duplicate Columns Node solves problems without requiring a […]| Dev3lop
Familiar with graphs? How about DAGs? This is not a paradigm shift, but think of DAG as a cool way for tiny team in Austin/Dallas Texas to build an Extract Transform and Load software! Like a guitar pedal, there’s an input and output. Sometimes it’s just an output. Then you have your input only tools. […]| Dev3lop
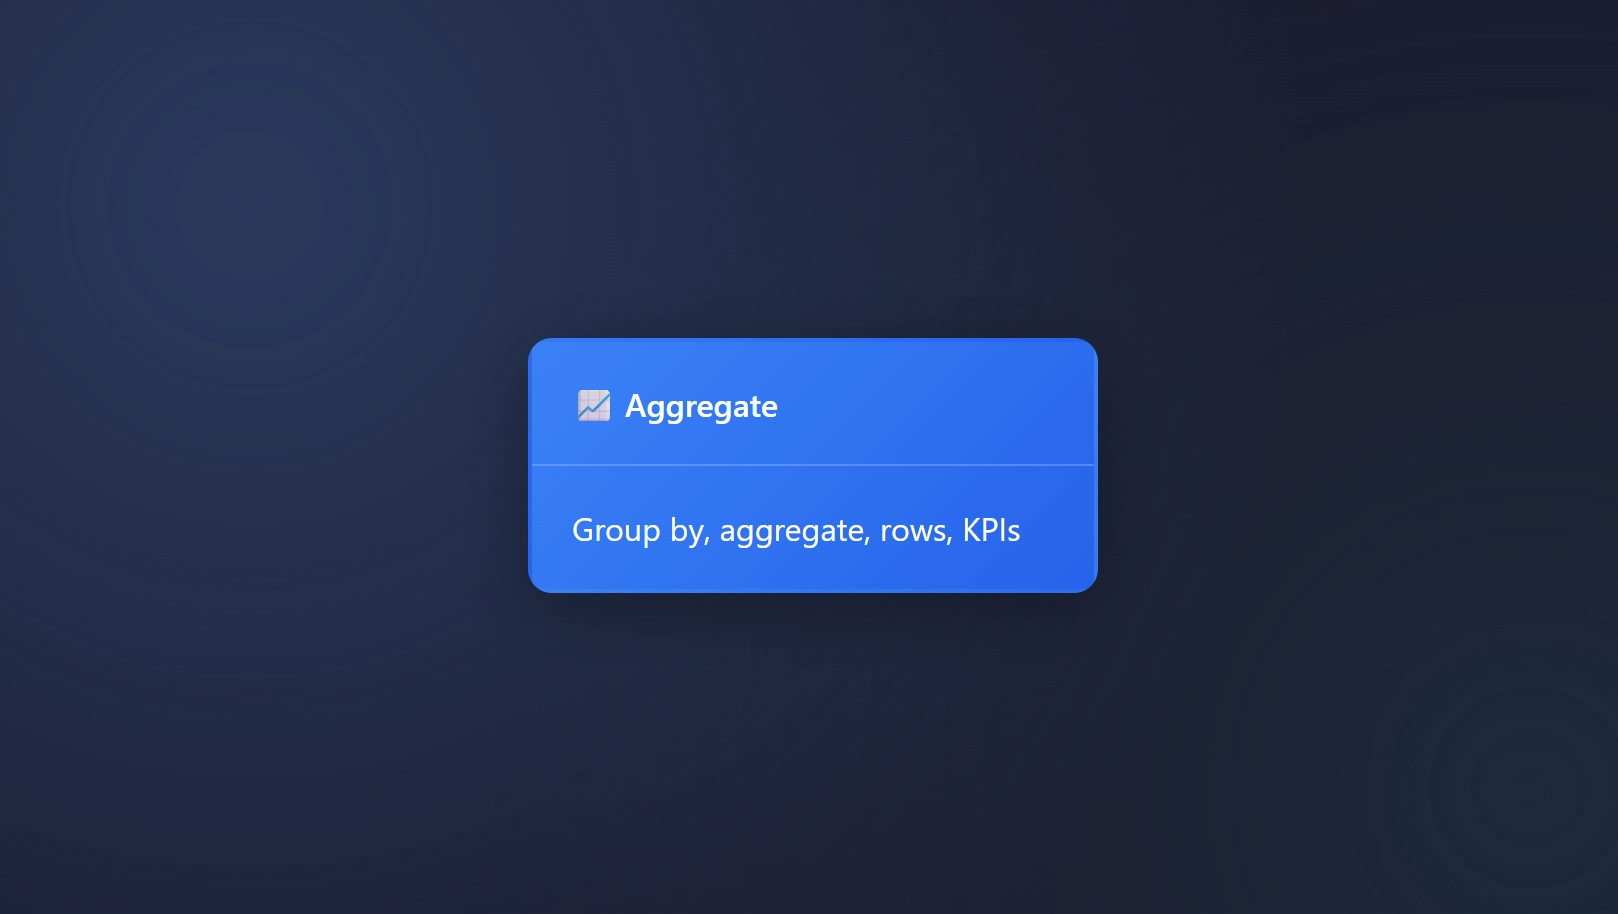
Aggregation, what a classic. Aggregating your data is a landmark trait for any data steward, data wrangler, or data analyst. In ET1, you can easily aggregate your data. The Power of Grouping (Group By) with the Aggregate Node Aggregations turn a sea of numbers into meaningful insights. Group by in ET1 is nested in the […]| Dev3lop
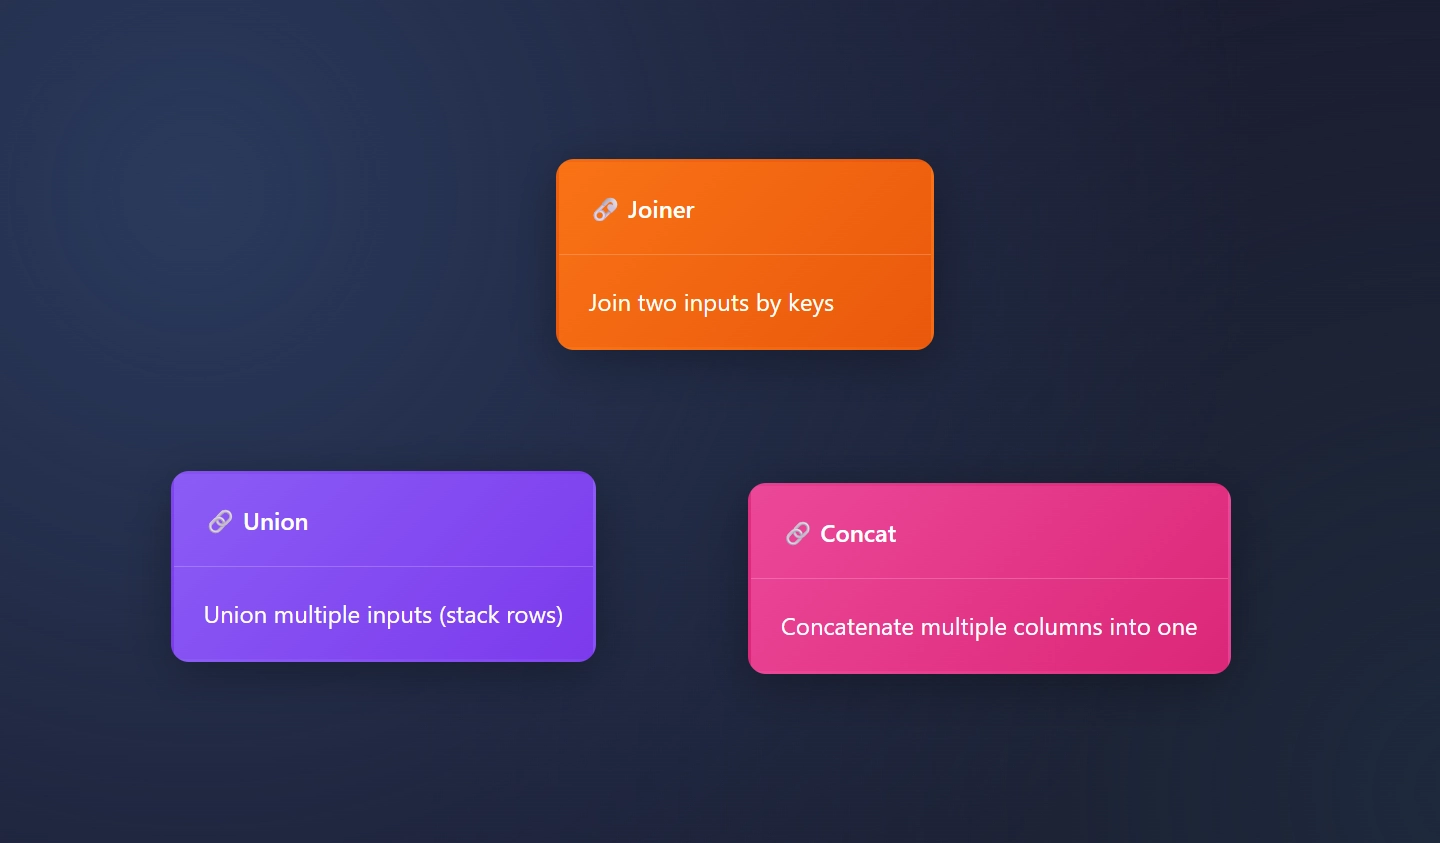
Are you combining the data? We have you covered. ET1 has all the right tools. The Three Musketeers of Data Combination 1. 🤝 Join (The Matchmaker) 2. 🔗 Union (The Stacker) 3. 🧵 Concat ([bring], [it], [together],[with],”glue”) Concat merges everything, and it doesn’t care about data types. Real-World Examples Join: Union: Concat: Pro Tips No […]| Dev3lop
The filtering nodes help you reduce the number of rows, drill into the exact information needed, and create a data set that will add value VS confuse your audience. When filtering, remember you’re reducing the amount of data coming through the node, or you can swap to include. Include, exclude, and ultimately work on your […]| Dev3lop
Market basket analysis is a technique used in retail to analyze customer purchase patterns and find connections between products. Businesses can improve their marketing strategies and increase sales by studying what items are frequently bought together. Predictive market basket analysis, the power of data visualization in data science, and big data technology help companies identify […]| Dev3lop
Fraud prevention is all about speed and precision. In a digital world where transactions happen in milliseconds, businesses can no longer afford delays. Enter webhooks—the silent game-changers that enable real-time alerts and actions. This article will break down what webhooks are, how they work, and why they’re essential for fraud detection. What Are Webhooks? Imagine […]| Dev3lop
Ready to break into the data industry? Use our comprehensive guide! “Success is not final, failure is not fatal: It is the courage to continue that count.” – Winston Churchill. If you don’t mind failure as a form of learning, you will love the data industry. In today’s data-driven world, the demand for skilled professionals […]| Dev3lop
Consider the use case: Do we need to contact 300 people for interviews? After extensive natural language processing, data mining, and entity recognition, we learned only a tiny percentage have relevant experience. The “easy apply” means anyone will send you a resume, regardless of fit. We prefer using NLP instead of AI to sort through […]| Dev3lop
A CI/CD pipeline (Continuous Integration/Continuous Delivery pipeline) is an automated DevOps workflow that streamlines software build, test, and deployment stages for faster and more reliable releases. It merges code changes and runs continuous testing, minimizing human errors and accelerating delivery to production environments. By integrating DevOps automation practices, teams can implement continuous deployment strategies that […]| Dev3lop
Did you know that PostgreSQL and SQL Server are two of the most popular databases for managing relational data worldwide? These databases are commonly used for enterprise edition applications, allowing developers to define primary key constraints and efficiently manage data. With the integration of Google Cloud, AWS, Azure, and others, developers can take advantage of […]| Dev3lop
In today’s data-driven world, organizations are constantly seeking ways to gain a competitive edge and uncover hidden opportunities that can drive business growth. In this comprehensive guide, we will help you uncover hidden opportunities, which contain untapped growth potential through data analytics. By harnessing the power of data, businesses can gain insights into customer behavior, […]| Dev3lop
Today’s blog is about the min(1) paradigm for KPI charting in Tableau desktop and how to make advanced KPI charts without needing slow table calculations to do the computations for you. Instead, we will show you how to utilize Tableau features to generate a better KPI solution. Welcome to learning how to create a min(1) […]| Dev3lop
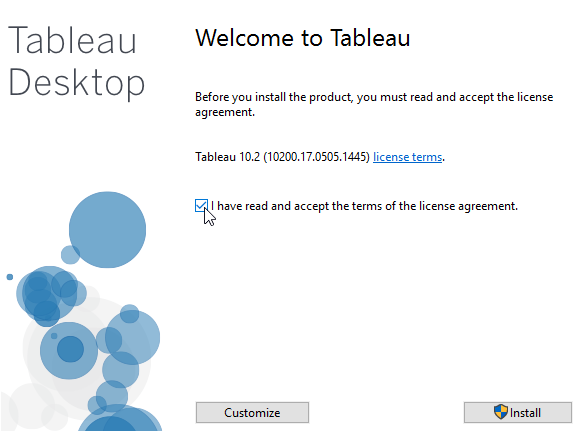
Let’s learn how to Install Tableau Desktop and kick-start your data analyst career. If you’re breaking into the data industry, learning that data visualization is important in data science, or unlocking the power of data for the first time… Welcome, or maybe you’re deep into the realm of understanding the nuanced differences between Tableau VS […]| Dev3lop
My name is Tyler Garrett, I’m a Senior Consultant and founder of dev3lop. I’m excited to talk to you about how artificial intelligence, is used, in the real world. Artificial Intelligence (AI) has moved far beyond futuristic concepts. Today, AI is actively transforming how businesses compete, grow, and survive. AI Agents consulting services and AI […]| Dev3lop
Advanced analytics consulting services in Austin, Texas. Whether you’re a small business, government agency, enterprise, e-commerce platform or senior engineer looking for an analytics consultant. Dev3lop offers tailored advanced analytics consulting services to support any analytics environment.| Dev3lop
I’m sure you know, data engineering has emerged as a pivotal force driving business profitability and operational efficiency. By effectively managing, pulling, and transforming raw data into actionable insights, organizations can make informed decisions that enhance productivity and boost profit margins. As we look toward 2025, several key trends in data engineering are set to […]| Dev3lop
In a world where data drives competitive advantage, businesses are often drowning in information but starving for insights. If your organization struggles with fragmented reporting, slow decision-making, or disconnected analytics, it may be time to consider a data warehouse. A data warehouse centralizes data from multiple sources into a single data source. But how do […]| Dev3lop
The ability to network with data science professionals is a valuable skill that can open doors to exciting opportunities and foster your personal and professional growth. It would be best if you created long-lasting connections while networking. Long-lasting relationships that will get you ahead in life, and similar to attending school, these are people who […]| Dev3lop
Welcome to a Comprehensive API Guide, which includes a lot of research. Businesses need help migrating data from every system, and most systems have an API, or their API is “paid,” which is not the most exciting but a part of the API development workflow. Considering the demand and technical depth, we need a monster-size […]| Dev3lop
Data Engineering Consulting Services in Austin, TX. We solve your data engineering needs. We help companies clean, join and visualize their data via Training & Consulting.| Dev3lop
In today’s data-driven business landscape, information is often described as the “new oil.” Yet, not all data is created equal and most are still stuck in spreadsheet land. While many companies invest heavily in analytics tools and data platforms, one critical factor often gets sidelined: data quality. Like duplicates, what are we doing about duplicates? […]| Dev3lop
There’s a strange irony in how many businesses chase AI-powered insights while still relying on spreadsheets and CSV files for critical reporting. Everyone’s eager to talk about machine learning, automation, and next-gen analytics, but behind the scenes, many companies are still manually copying data from system to system, dragging CSVs into dashboards, and wondering why […]| Dev3lop
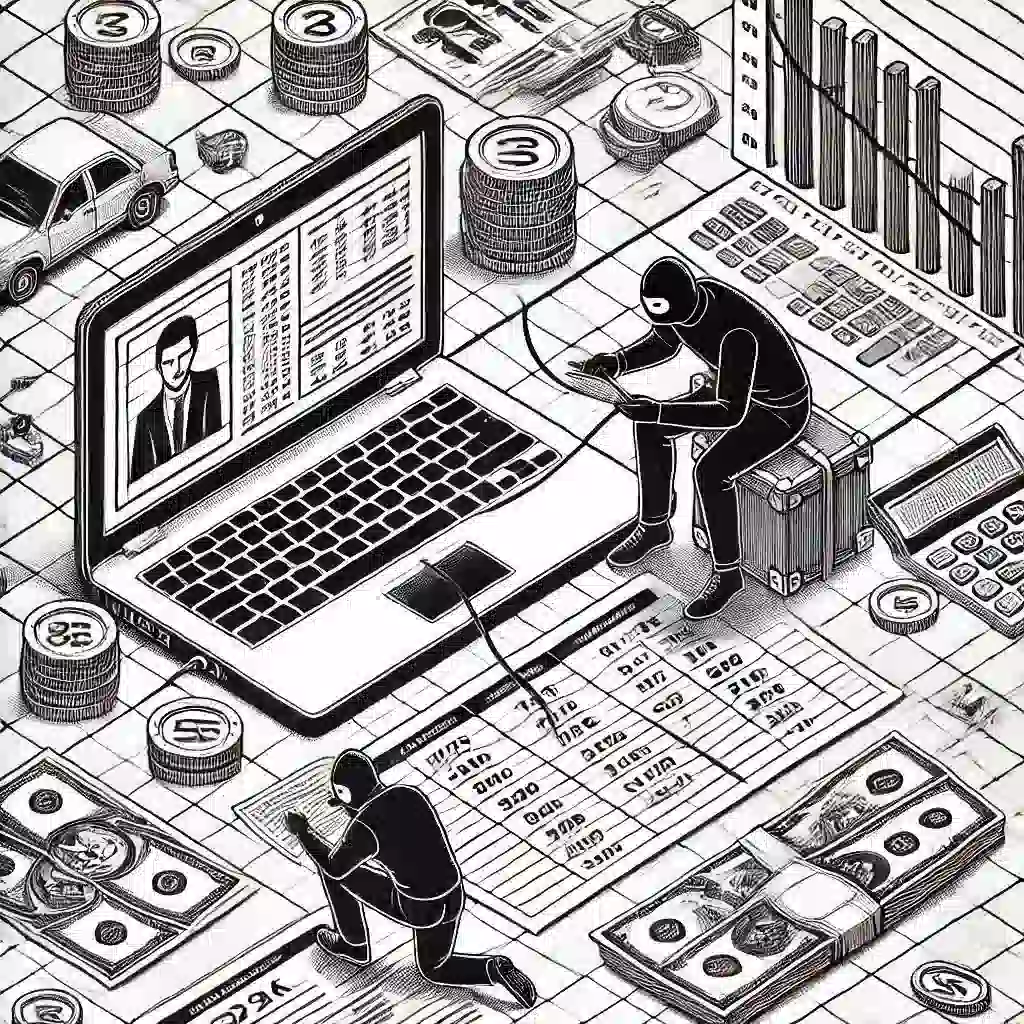
Fraud detection is no longer just about reacting to incidents; it’s about predicting and preventing them before they escalate. At the heart of this proactive approach is machine learning (ML)—a powerful tool that enables systems to spot patterns and anomalies in ways humans simply cannot. To understand how ML fits into fraud detection, think of […]| Dev3lop
Fraud detection is no longer about reacting after the damage is done—it’s about prevention, powered by real-time insights. With open-source tools like WebSockets and Node.js, businesses can build scalable, efficient fraud detection systems without breaking the bank. This article dives into how these technologies work together to stop fraud in its tracks, offering practical solutions […]| Dev3lop
Fraud detection has come a long way. What once relied on manual reviews and endless spreadsheets is now powered by real-time streaming data, automation, and advanced engineering techniques. Let’s explore this journey, highlighting why businesses must evolve their fraud detection strategies to stay ahead. The Spreadsheet Era – Where It All Began In the early […]| Dev3lop
Advanced ETL Consulting Services in Austin, TX. We help solve client ETL needs. We help companies clean, join and visualize their data via Training & Consulting.| Dev3lop
Are you seeking to learn more about the importance of data visualization in data science and trying to get beyond what ChatGPT is saying? Explained by advanced analytics consultants who spend their time in Big Data Technology and have a rich history in Data Mining for enterprise companies? You’re in luck—we are a legit consultancy […]| DEV3LOPCOM, LLC
Processing unstructured text can take various approaches. One way is to split paragraphs based on new lines and break sentences by focusing on spaces. However, this can lead to the need for sourcing your own scoring data to join with your unstructured data source, and that requires data warehousing services internally or externally. Finding, cleaning, […]| DEV3LOPCOM, LLC
As you start working with Power BI, you’ll encounter an important decision: How do I connect to data in my reports, and what is the difference between Import vs Direct Query Power BI? Then you google for insights and find a few “technical consultant” focused blogs, that discuss significant differences thing sentences, and we wanted […]| DEV3LOPCOM, LLC
The GROUP BY clause in SQL is a powerful feature that allows you to group rows based on the values in one or more columns. It enables you to perform aggregate functions on groups of data, producing summary results from large datasets. By using the GROUP BY clause effectively, you can gain valuable insights and […]| DEV3LOPCOM, LLC
Data Warehousing Consulting Services in Austin, TX. We solve your data warehousing needs. We help companies clean, join and visualize their data via Training & Consulting.| DEV3LOPCOM, LLC
Data, the essence of knowledge and decision-making in computer science, has become indispensable in today’s digital age. Data science, machine learning, and AI have revolutionized how we understand and utilize information with their ability to collect, analyze, and process data using computer databases or document storage. Emerging technology has greatly enhanced our knowledge, our ability […]| DEV3LOPCOM, LLC
Are you trying to write faster calculations in Tableau Desktop? Or are you interested in optimizing your calculations for improved speeds in Tableau Desktop? You’re in good company. Dev3lop is an advanced analytics consultancy, that started our business helping one client with Tableau Desktop. Our article is here to assist you in: To excel in quick […]| DEV3LOPCOM, LLC
Data mining allows people to fix, find, replace, update, and report on their findings. So, imagine stumbling upon an old attic filled with forgotten treasures after looking through the entire house. Finding answers to your questions is like mining these treasures, and in this era of AI, getting new information can be exciting or inspire […]| DEV3LOPCOM, LLC
Organizations are inundated with vast amounts of information that serve as the lifeblood of their operations. Whether it’s customer data, financial records, or market insights, harnessing and trusting your data is paramount. Data governance can be used to ensure that data remains accurate, reliable, and secure. In this comprehensive data governance guide, we’ll delve into […]| DEV3LOPCOM, LLC
The adoption of big data technologies has revolutionized industries across various sectors. Organizations can now extract valuable insights from their vast datasets, enabling informed decision-making and driving business growth. With the ability to process structured and unstructured data in real-time, big data technologies have opened up new possibilities for businesses to gain a competitive edge. […]| Dev3lop
We believe the best reporting environment makes room for everyone’s combined experiences, whether it’s Tableau VS Power BI or another data visualization product. That’s why you see many organizations with a sprawl of products, and that’s a good thing because the more people accessing the data with these products, the better your data will become! […]| Dev3lop