The City of Chicago now publishes trip-level data for every ride-hail trip taken since November 1, 2018. Chicago isn’t the first major US city to make ride-hailing trip data publicly available—New York has published Uber and Lyft data since 2014—but the Chicago dataset includes additional fields, most notably fare amounts, that provide new insights into the ride-hailing landscape.| Todd W. Schneider
The New York Police Department provides data for every motor vehicle collision in NYC since July 2012. Each record includes location coordinates and other metadata, most notably the number of injuries and fatalities, segmented further by motorists, cyclists, and pedestrians.| Todd W. Schneider
If you’ve been on a New York City subway platform since January 2018, you should have noticed a countdown clock that displayed an estimate of when the next train would arrive. Although there’s no official record of when trains actually stopped at each station, the countdown clock data can be used to approximate. Over the past 5 months, I’ve collected and processed some 24 million stops’ worth of this data to try to make sense of New York’s vast and troubled subway system. The code i...| Todd W. Schneider
I wrote an open-source app called NBA Shots DB that uses the NBA Stats API to populate a database with all 4.5 million shots attempted in NBA games since 1996. The app also processes a dataset provided by Sportradar of over 1 million NCAA men’s shot attempts since 2013 into a format that can be merged with the NBA data. Both datasets include similar information: location coordinates, player and team names, which shots went in, and so on. The merged dataset allows us to compare NBA and NCAA ...| Todd W. Schneider
The City of Chicago has released a public dataset containing over 100 million taxi rides since 2013. I adapted my analysis of the similar New York City dataset to process the Chicago data, and created a GitHub repository with the relevant code.| Todd W. Schneider
The Simpsons needs no introduction. At 27 seasons and counting, it’s the longest-running scripted series in the history of American primetime television.| Todd W. Schneider
It’s fairly commonplace these days for news outlets to reference prediction markets as part of the election cycle. We often hear about betting odds on who will win the primary or be the next president, but I haven’t seen many commentators use prediction markets to infer the electability of each candidate.| Todd W. Schneider
LearnedLeague bills itself as “the greatest web-based trivia league in all of civilized earth.” Having been fortunate enough to partake in the past 3 seasons, I’m inclined to agree.| Todd W. Schneider
FiveThirtyEight and Inpredictable teamed up to make a nice interactive visualization that shows every NBA team’s chances of winning at every minute of every game, according to Inpredictable’s basketball win probability calculator.| Todd W. Schneider
NAND gates are functionally complete, which means that you can implement any boolean function using only NAND gates, even one as complicated as Twitter’s corporate strategy statement:| Todd W. Schneider
I was pleasantly surprised when somebody shared my traveling salesman animation to reddit and the post made it all the way to reddit’s default front page (i.e. the top 25). The gif racked up over 1.3 million pageviews on Imgur, a testament to reddit’s traffic-generating prowess. Before the post made it to the front page, though, it was brought to my attention that it was on the second page of reddit, and that with a bit of luck, maybe it would make it to the front page.| Todd W. Schneider
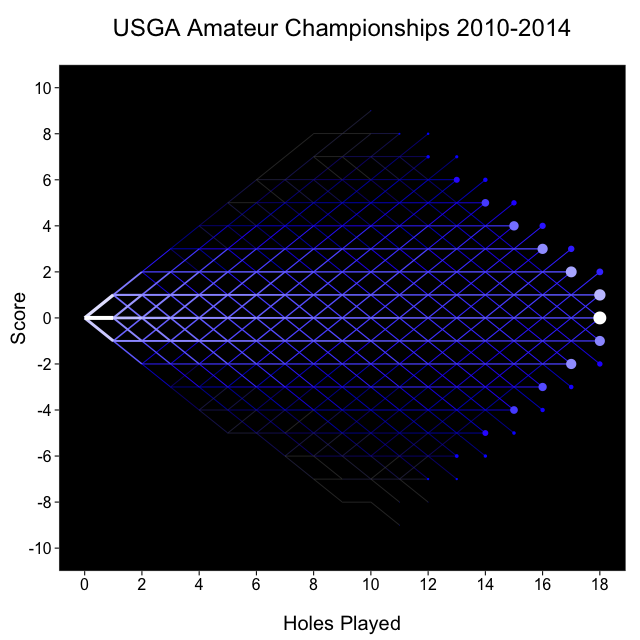
In honor of the Ryder Cup, here's a fun puzzle for the mathematically inclined golfer to consider: how many paths are possible in an 18 hole round of match play golf? Plus we'll take a look at some …| toddwschneider.com
The New York City Taxi & Limousine Commission has released a staggeringly detailed historical dataset covering over 1.1 billion individual taxi trips in the city from January 2009 through June 2015. …| toddwschneider.com
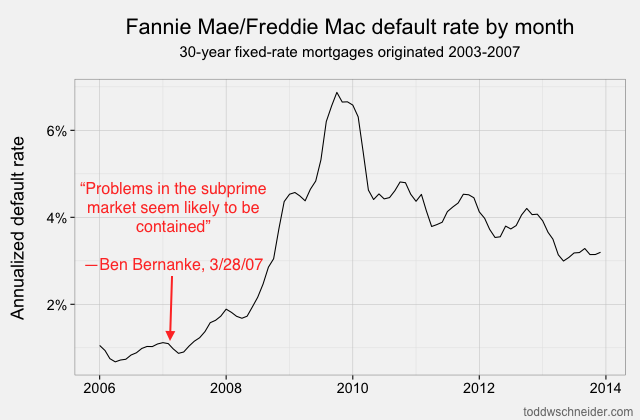
[M]ortgages were acknowledged to be the most mathematically complex securities in the marketplace. The complexity arose entirely out of the option the homeowner has to prepay his loan; it was poetic …| toddwschneider.com
I built an interactive Shiny application that uses simulated annealing to solve the famous traveling salesman problem. You can play around with it to create and solve your own tours at the bottom of …| toddwschneider.com