Use the EFFECTPLOT statement to visualize regression models in SAS - The DO Loop
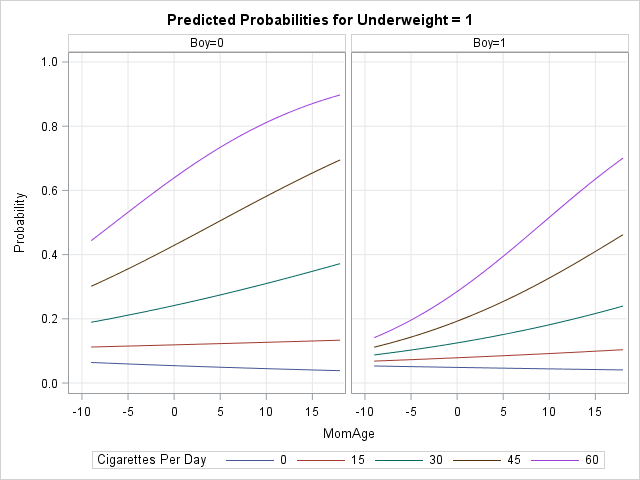
Graphs enable you to visualize how the predicted values for a regression model depend on the model effects.| The DO Loop
Graphs enable you to visualize how the predicted values for a regression model depend on the model effects.| The DO Loop
