Login
From:
The DO Loop
(Uncensored)
subscribe
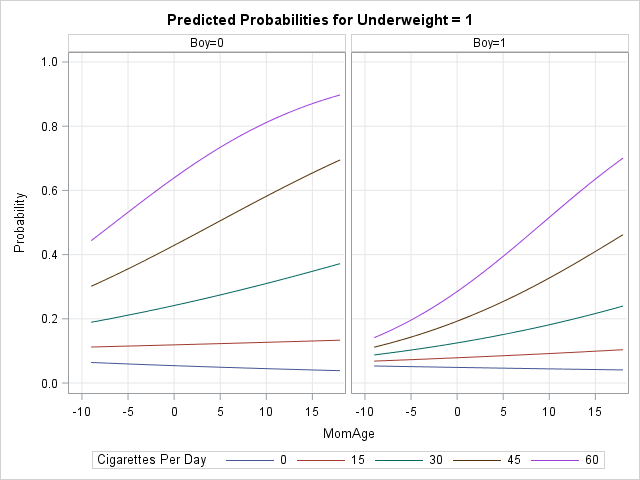
Use the EFFECTPLOT statement to visualize regression models in SAS - The DO Loop
https://blogs.sas.com/content/iml/2016/06/22/sas-effectplot-statement.html
links
backlinks
Graphs enable you to visualize how the predicted values for a regression model depend on the model effects.
Roast topics
Find topics
Roast it!
Roast topics
Find topics
Find it!
Roast topics
Find topics
Find it!