User Satisfaction vs. Performance Metrics - NN/G
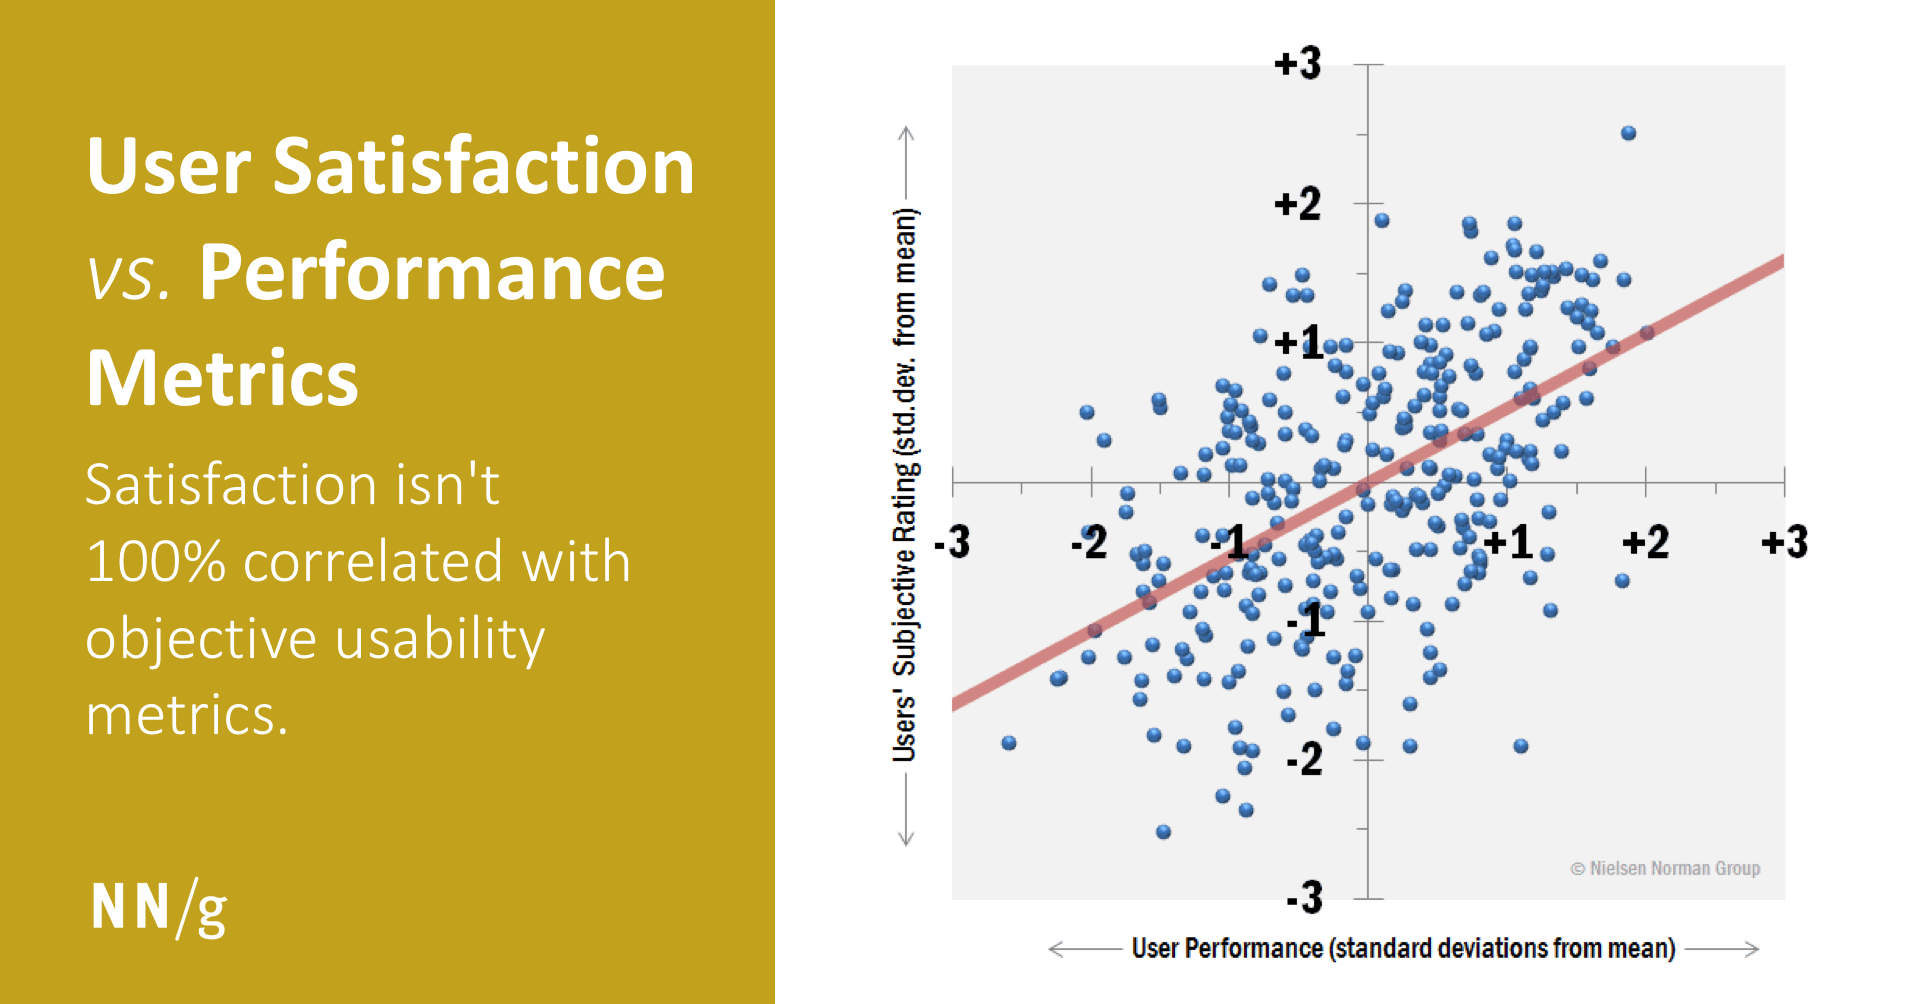
Users generally prefer designs that are fast and easy to use, but satisfaction isn't 100% correlated with objective usability metrics.| Nielsen Norman Group
Users generally prefer designs that are fast and easy to use, but satisfaction isn't 100% correlated with objective usability metrics.| Nielsen Norman Group
Over the past decade, usability improved by 6% per year. This is a faster rate than most other fields, but much slower than technology advances might have predicted.| Nielsen Norman Group
Need numerical data about your product’s UX, but not sure where to start? Check out this list of the most popular quantitative methods to help you pick a tool.| Nielsen Norman Group

Our research shows that tutorials don’t make users faster or more successful at completing tasks; on the contrary, they make them perceive the tasks as more difficult.| Nielsen Norman Group
Increased conversion is one of the strongest ROI arguments for better user experience and more user research. Track over time, because it's a relative metric.| Nielsen Norman Group
Measured usability improved by 44% compared to our last large-scale intranet study. The new research identified 5 times the previous number of intranet design guidelines.| Nielsen Norman Group

Depending on how representative designers are of the target audience, a project might need more or less user testing. Still, usability concerns never go away completely.| Nielsen Norman Group

NPS is a loyalty metric that correlates well with perception of usability, is easy to understand and administer, but has limitations for understanding and evaluating UX when used in isolation.| Nielsen Norman Group
