rrdgraph_graph| oss.oetiker.ch
rrdgraph_examples| oss.oetiker.ch
rrdgraph_data| oss.oetiker.ch
rrdfetch| oss.oetiker.ch
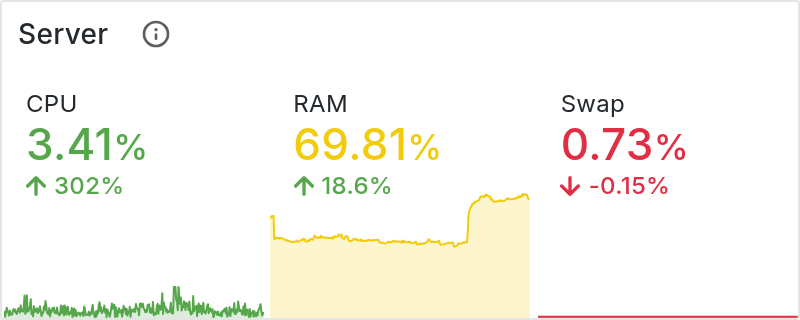
When it comes to rendering graphical representation of all the metrics I gather, I generally use RRDtool . Yes, I’m that old ;-) But I also have a Grafana instance from which I render stuff that can’t be done using RRDgraph. But, so far, I couldn’t generate a static PNG file from a panel to insert in a static web page. But this was until I found the Grafana Image Rendered plug-in.| www.tumfatig.net
rrdgraph| oss.oetiker.ch
It seems like every company these days has two things they turn to when first hitting an incident. a) Is there an Alert Reference / Runbook / Whatever (the actual term depends on who you talk to), and b) Is there a dashboard that can tell me exactly what’s wrong. In this post, I’m going to cover why these tools are not only unhelpful, but are actively harmful to your incident response.| blog.colindou.ch