
Salesforce Winter ‘26 Release: What You Need to Know - Cloud for Good
Maximize your Salesforce investment with the latest updates in Salesforce's Winter '26 release, which brings reporting enhancements and simplifies org management.| Cloud for Good
Maximize your Salesforce investment with the latest updates in Salesforce's Winter '26 release, which brings reporting enhancements and simplifies org management.| Cloud for Good
In this week’s Data Diaries, let’s talk about breaking down a process. This is something that Katie advises all the time in things like our AI-Ready Strategist Course. One of my favorite tricks for doing this is, unsurprisingly, to use AI. Here’s how. First, open the voice memos app or voice transcription app of your choice. [...]Read More... from Process Documentation with AI| Trust Insights Marketing Analytics Consulting
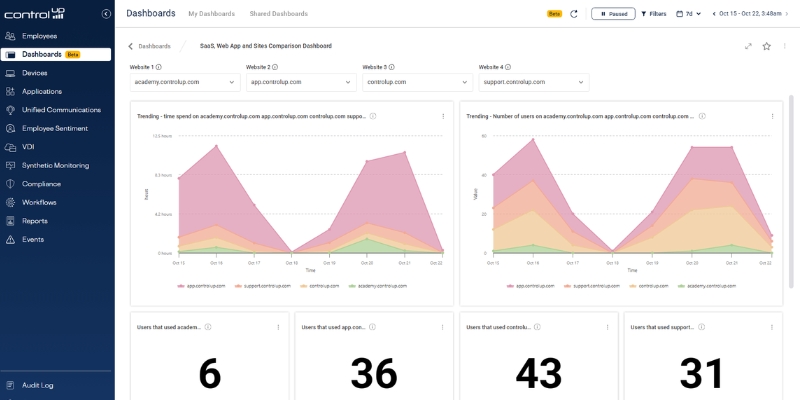
ControlUp Dashboards introduce pre-built and customizable views with interactive widgets seamlessly integrated into the ControlUp ONE platform.| Digital IT News
Despite having cutting-edge tools and accumulating large amounts of data, marketing departments still have difficulties proving their impact on the whole business. The MarTech industry was thought to simplify everything, but it became a noise-filled market with over 8,000 solutions where each vendor claims to be the best but many actually contribute to the confusion. […] The post The Future of Martech Leadership: From Data Management to Strategic Transformation appeared first on Martech360.| Martech360
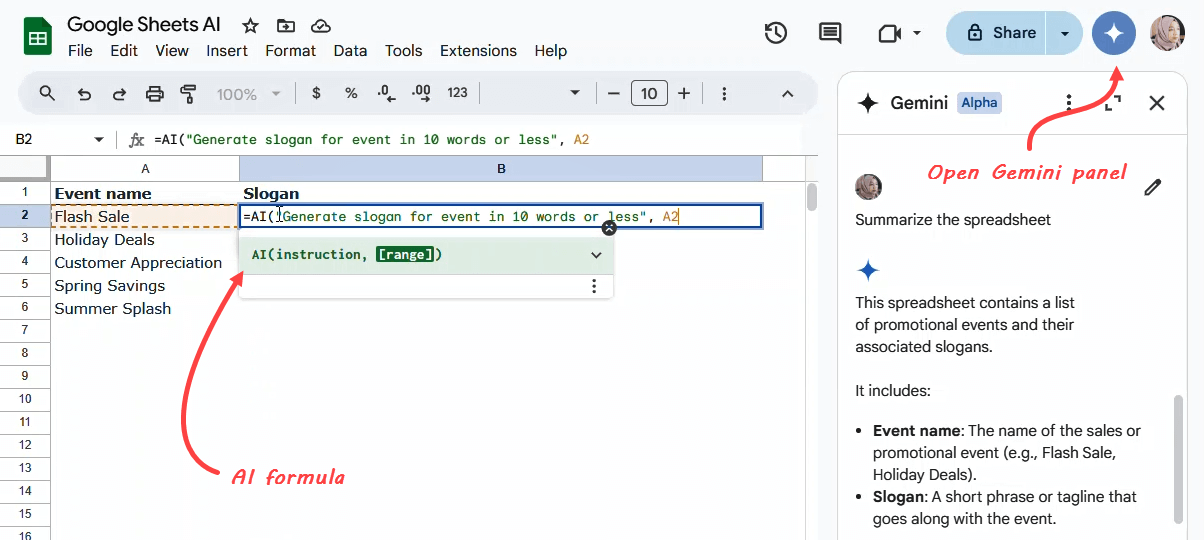
Master the Google Sheets AI formula with our quick guide. Learn to generate text, summarize information, categorize data, and analyze sentiment directly in your spreadsheets.| Coupler.io Blog
As we move into 2026, data is becoming more crucial than ever for businesses. How you gather, use, and analyze data directly impacts how your company communicates and operates. For SaaS brands, managing KPI dashboards has become a must. These dashboards make it easier for professionals to access, understand, and adjust key metrics. A well-organized […]| Usermaven
Introducing Embrace's new Overview Page, your engineering team's launchpad for mobile and web observability.| Embrace
Looking for ready-to-use Looker Studio Marketing dashboards? We’ve gathered 19 of the best for you to try out. The post 32 Best Looker Studio Marketing Dashboards for Data-Driven Decisions appeared first on Coupler.io Blog.| Coupler.io Blog
Explore the free Google Calendar dashboard template that provides you with an overview of your scheduling performance in the last 12 months. The post I Know What You Did Last Year – Google Calendar Dashboard For Your Last 12 Months appeared first on Coupler.io Blog.| Coupler.io Blog
Nagios XI 2026 marks a new chapter in the evolution of monitoring and visualization.This release introduces Smart Dashboards, a reimagined way to view, organize, and act on monitoring data. Designed from the ground up, Smart Dashboards combine modern design, advanced customization, and team collaboration into a unified, dynamic interface. For years, Nagios dashboards have been […]| Nagios Library
I would like to credit for this blog post to Abhishek Sharma, talking to him gave me the main inspiration for some of the concepts you are going to see below. Heartfelt thanks go as well to Niti Gupta, a kickass Microsoft engineer who can make Azure Monitor Workbooks really dance and who gave me … Continue reading Grafana and VNet Flow Logs| Cloudtrooper

Pinpoint the source of RabbitMQ issues and performance degradation while increasing the visibility of connection, channel and queue behaviour with our 5 new RabbitMQ dashboards.| SeventhState.io
A roadmap is an invaluable tool to help ensure the success of any digital product development. A less experienced team may only see the tip of the iceberg: the 10% of the work and collaboration that they can easily imagine. As an experienced product manager, you know that it’s the 90% that is beneath...| Boost Labs – Digital Product Agency
We’re a digital development company, with an experienced team of developers and designers who build digital products and help you tell your story with your data. But that doesn’t mean that we’re always the right fit for companies who need digital product development...| Boost Labs - Digital Product Agency
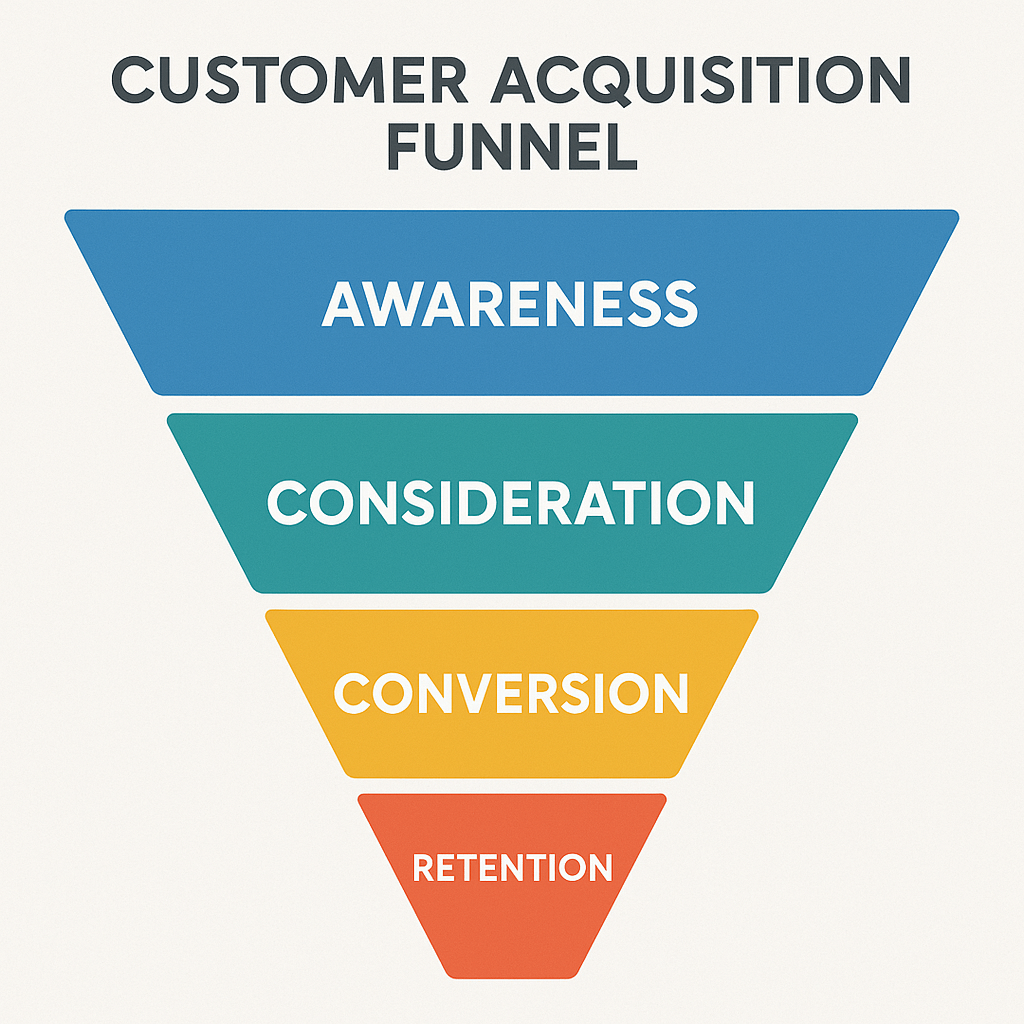
Track, analyze, and optimize your customer acquisition funnel with proven metrics, analysis techniques, expert strategies, and free dashboard templates.| Coupler.io Blog

The best part about these overlooked revenue streams? You don’t have to reinvent your agency. You’re already doing most of the work — you just need to monetize it.| Predictable Profits

Discover how personalized dashboards can transform internal comms from overlooked to unmissable - boosting connection and engagement.| Ichicraft Boards
Yes, this post is quite specific, but I seldom see these functions used by other spreadsheet modellers even though I find they […] The post Why I Love the *IFS Functions in Excel appeared first on Analytical Models.| Analytical Models
What level of instruction do you provide to your staff if they must undertake periodic maintenance as part of their job? Are […] The post How Exact and Safe are Your Maintenance Regimes? appeared first on Analytical Models.| Analytical Models
In today’s digital world, we can view websites and data visualizations wherever we go – on a laptop, tablet, or mobile phone. However, just because we can access digital material on various devices doesn’t mean that the content has been optimized or built for the device we are using at the time. Mobile Frustration Have […] The post Designing Mobile-Friendly Dashboards: A Case Study with NJ-SHO appeared first on Kaleido Analytics.| Kaleido Analytics

5 barriers holding CFOs back and how modern tools like Hurree can unlock growth, improve accuracy, and empower finance teams to make smarter decisions| blog.hurree.co

In this blog, we explore the 10 financial dashboards every team should have in their arsenal. Because if you don’t, you’re not just missing insights, you’re falling behind.| blog.hurree.co
Hendrik Makait2023-05-16| Blog
We are launching the AI Benchmarking Hub: a platform presenting our evaluations of leading models on challenging benchmarks, with analysis of trends in AI capabilities.| Epoch AI

Are you trying to write faster calculations in Tableau Desktop? Or are you interested in optimizing your calculations for improved speeds in Tableau Desktop? You’re in good company. Dev3lop is an advanced analytics consultancy, that started our business helping one client with Tableau Desktop. Our article is here to assist you in: To excel in quick […]| DEV3LOPCOM, LLC

In this post we’re exploring dashboards and sharing some examples using Highcharts® Dashboards. Dashboards are useful for businesses and organizations to visualize data in a clear and simple way. They let you see trends, patterns, and key information into one accessible place, making it easier to understand the current state of your organization and take| Highcharts Blog | Highcharts

In the business of consulting, our clients rely heavily on data visualization to make sense of complex information and drive decision-making.| Nightingale

Dashboard design elements There are five important elements to consider in the design phase for building great data visualizations.| Nightingale

Discover the advantages of marketing dashboards and essential KPIs to incorporate, complete with actionable examples for effective guidance.| blog.hurree.co
When I was young I used to watch reruns of the original Star Trek. But I didn’t know they were Read Now The post Tableau Trek: Exploring and Using New Features of Tableau and Tableau Prep at #DATA19! appeared first on VizPainter.| VizPainter
Dynamic Parameters in Tableau is one of the most requested features of all time. Tableau’s developers have tackled individual use Read Now The post Dynamic Parameters in Tableau appeared first on VizPainter.| VizPainter

Social media dashboards provide a centralised view of important metrics from various channels. Here are tips to build the perfect social media dashboard.| blog.hurree.co

Learn the definition of Key Performance Indicators, the benefits of having KPIs and the 11 different types of KPI. Learn more now!| blog.hurree.co

Analyze diverse metrics in a single-pane of glass and set up dashboards in minutes with Datadog.| Datadog
