How a phantom single quote from bash's set -x caused random CI build failures through a race condition between stdout and stderr in Azure Pipelines.| QuestDB Blog
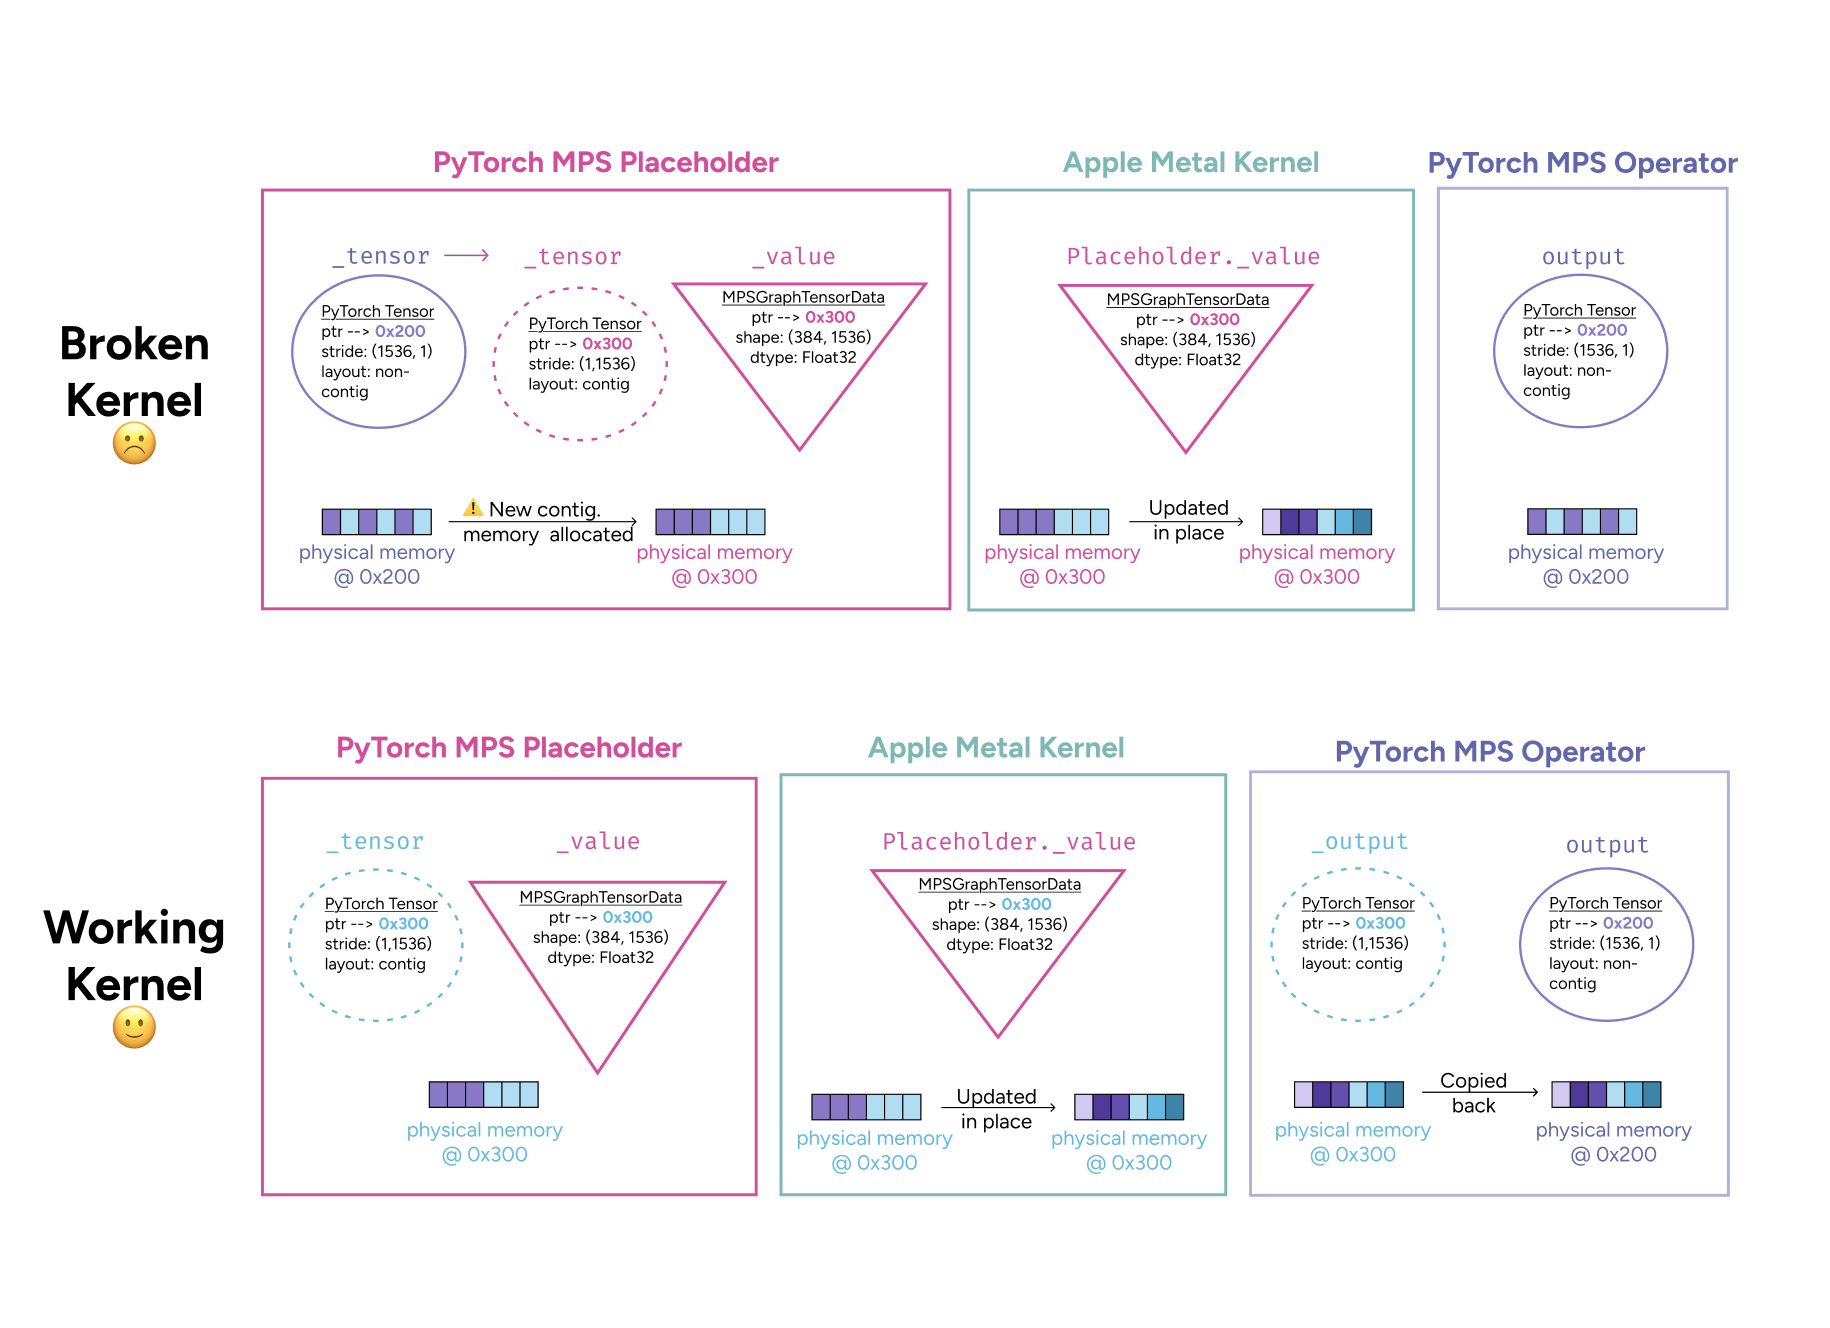
a loss plateau that looked like my mistake turned out to be a PyTorch bug. tracking it down meant peeling back every layer of abstraction, from optimizer internals to GPU kernels.| elanapearl.github.io
In my previous article, I shared with you the steps I took, to further automate setting up my demo environment, and implementing a Service with service type LoadBalancer. Some years ago, I also wrote articles about the Quarkus Kubernetes Extension. This time I wanted to have a look at some others aspects of the Quarkus Kubernetes Extension, that I came across. Part of the “Developer Joy” is the so called “Remote Development”. Run dev mode remotely with changes to local files immediate...| Conclusion AMIS Technology Blog
Everyone’s been talking about vibe coding lately. I’ve been doing it myself. Launched two projects. Okutaç and Caccepted. It’s the kind of work where you don’t analyze, architect, or overthink. You start simple. You come up with features. You poke at the product until it makes sense. You skip the logs, skip the diagrams, and rely on repetition and intuition […]| Yusuf Aytas
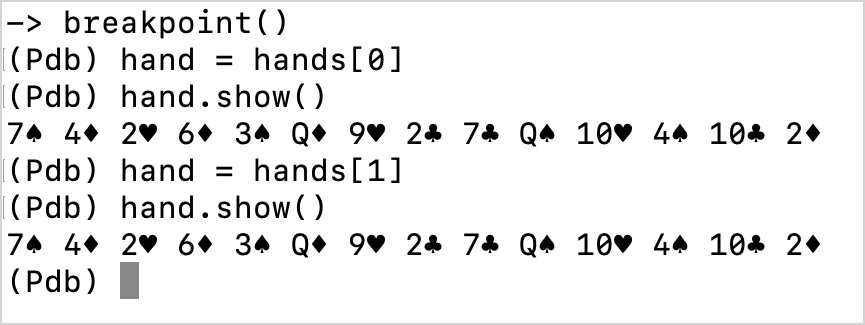
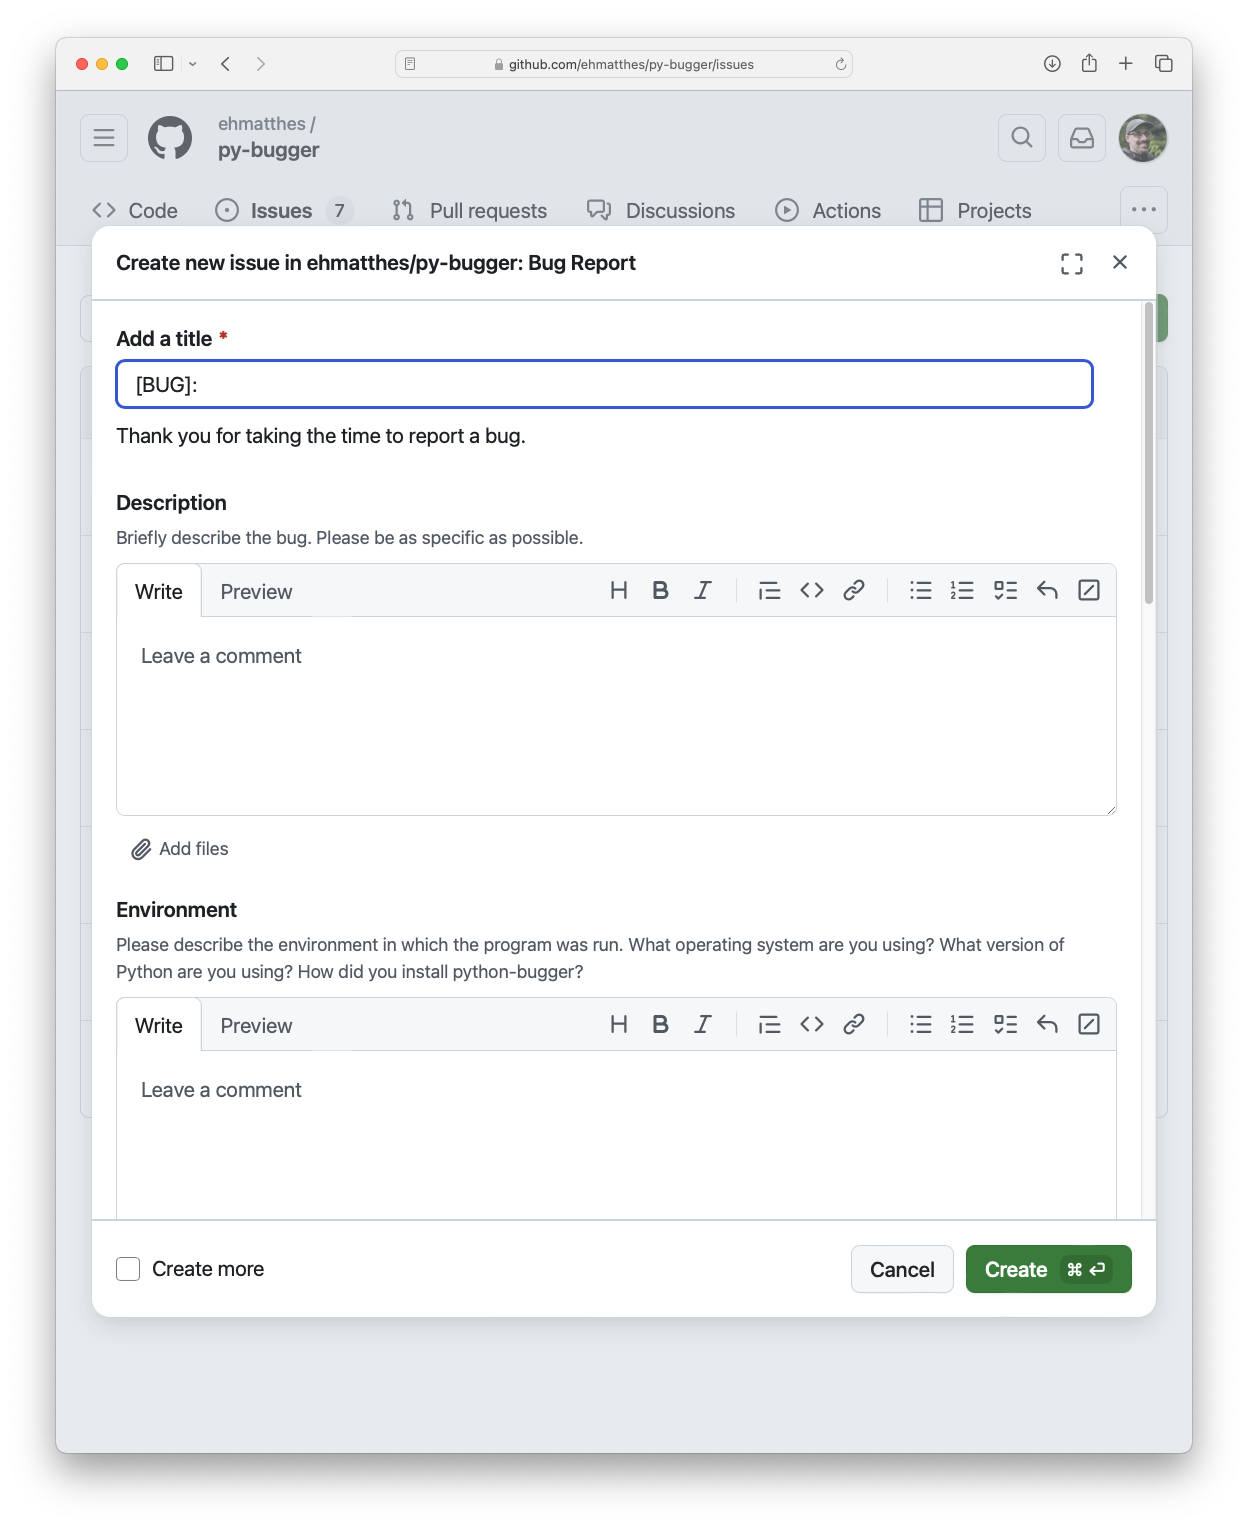
MP 151: How do you debug a program that doesn't crash? In the last two posts we made models called Card, Hand, and Deck, which can form the foundation of any game that uses playing cards. In this post we'll start building a terminal-based implementation of Go Fish. If you| Mostly Python
Last night, my wife looks up from her computer, troubled. She tells me she can’t log into her computer running Windows 11, as every time she enters the PIN code to her account, the login screen throws up a cryptic error: “Your credentials could not be verified”. She’s using the correct PIN code, so that surely isn’t it. We opt for the gold standard in troubleshooting and perform a quick reboot, but that doesn’t fix it. My initial instinct is that since she’s using an online acco...| OSnews
What happens when a mysterious bug causes all your tests to fail once or twice a week? We try to solve these mysteries, even if it takes a year.| Fastmail
The new Constexpr Debugger available in the first CLion 2025.3 EAP build allows you to stay in the compiler’s world and see what really happens.| The JetBrains Blog
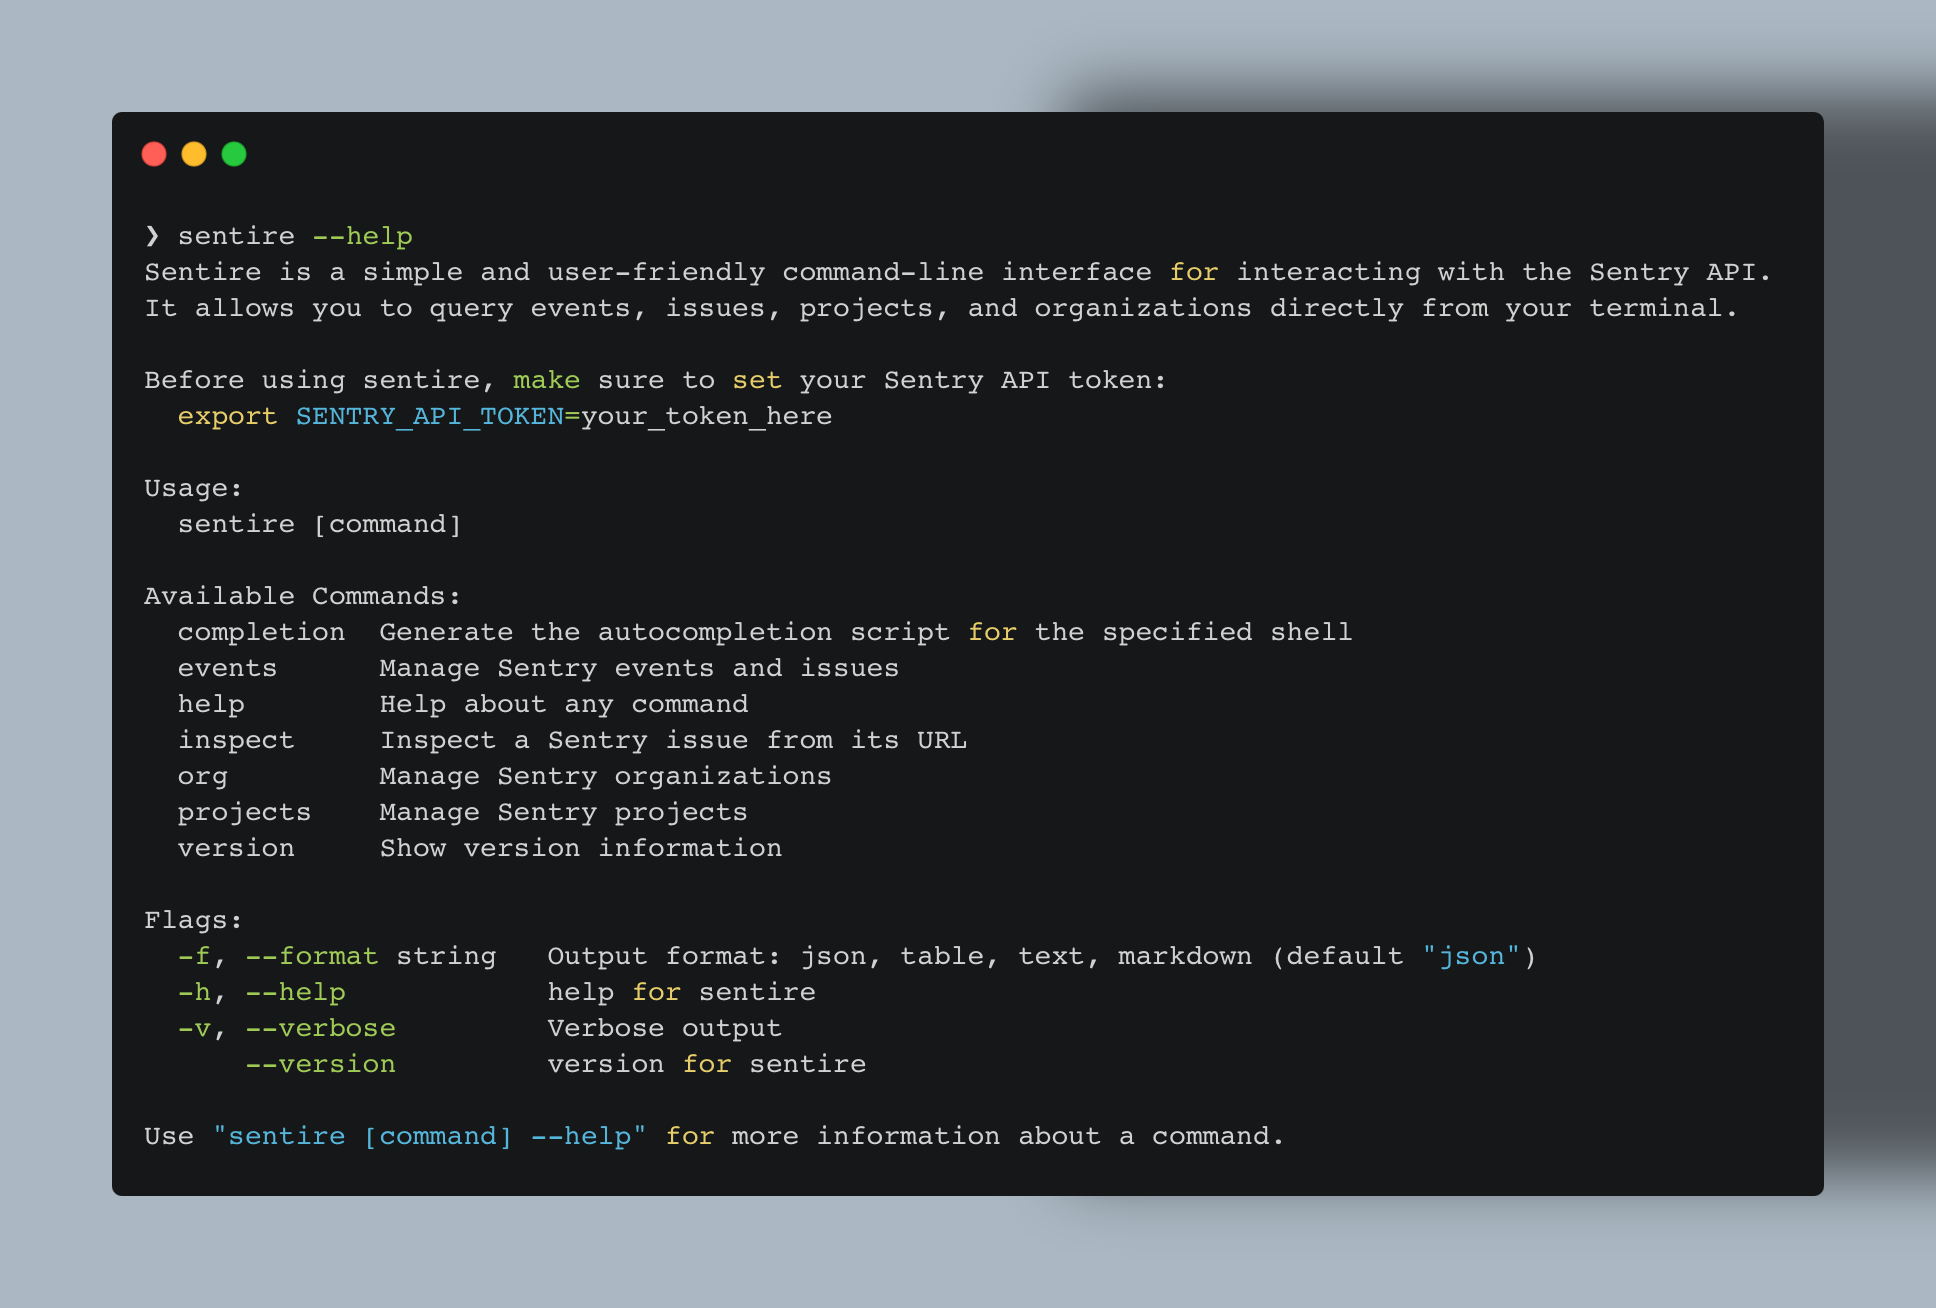
Introducing Sentire, a powerful command line interface for interacting with Sentry API, enabling developers to manage error tracking and monitoring directly from the terminal.| Andrea Grandi
In a previous article, I described a simple state machine to explain the prefetch behavior and miscellaneous observed bus delays of the Intel 8088. I now believe that the model I described there - although successful in modelling the 8088's behavior - was unnecessarily complex. There are in fact far fewer legitimate bus "delays", and they do not relate to internal state transitions. I have also slightly revised my description of the BIU's prefetching logic - I now believe that the prefetching...| Adventures in PC Emulation
MP 148: How small can a minimum reproducible example be? Note:My workload has increased over the last month, and I haven't had time to finish the current debugging series. It should be wrapped up in a few more posts, and those posts should come out over the| Mostly Python
Two podcast episodes—one from Oxide and one from Antithesis—on debugging at the limits and building correctness into systems from day one.| Pierre Zemb's Blog
This is a quick & unpolished collection of my Ruby debugging tips and recommendations. You can use the Ruby LSP extension to connect to debug.gem too. It requires a slightly different launch.json configuration (example) and provides better error han...| Mostly Ruby DX
This cheatsheet can help you get started with ruby/debug as well as use it in your daily development. It's not an exhausting list of its features or commands, so please go through its document as well. If you're migrating from byebug, I also recommen...| Mostly Ruby DX
Link to Japanese version: https://techracho.bpsinc.jp/hachi8833/2022_09_01 (Hashnode has issues generating the right link for this url) Link to my talk: ruby/debug - The best investment for your productivity Switching to a new debugger and potentiall...| Mostly Ruby DX
Do you know Ruby's official debugger ruby/debug provides out-of-box integration with VSCode? If you haven't tried it yet or having difficulty making it work, I hope this short post will help you set it up. Basic Setup Install the VSCode rdbg extensi...| Mostly Ruby DX
MP 146: What happens when the bug actually is in one of your project's dependencies? Note: This post is part of an ongoing series about debugging in Python. The posts in this series will only be available to paid subscribers for the first 6 weeks. After that they will be| Mostly Python
Introduction In Java programming, lambda expressions or Java one-liners have become widely adopted practices for writing concise and expressive code. These compact, anonymous functions introduce functional programming concepts to Java, streamlining operations on collections, simplifying data manipulation, and enhancing code readability. Introduced in Java 8, lambda expressions are designed to represent blocks of executable code. […] The post Simplifying Java One Liners (Lambda Expressions...| Lightrun
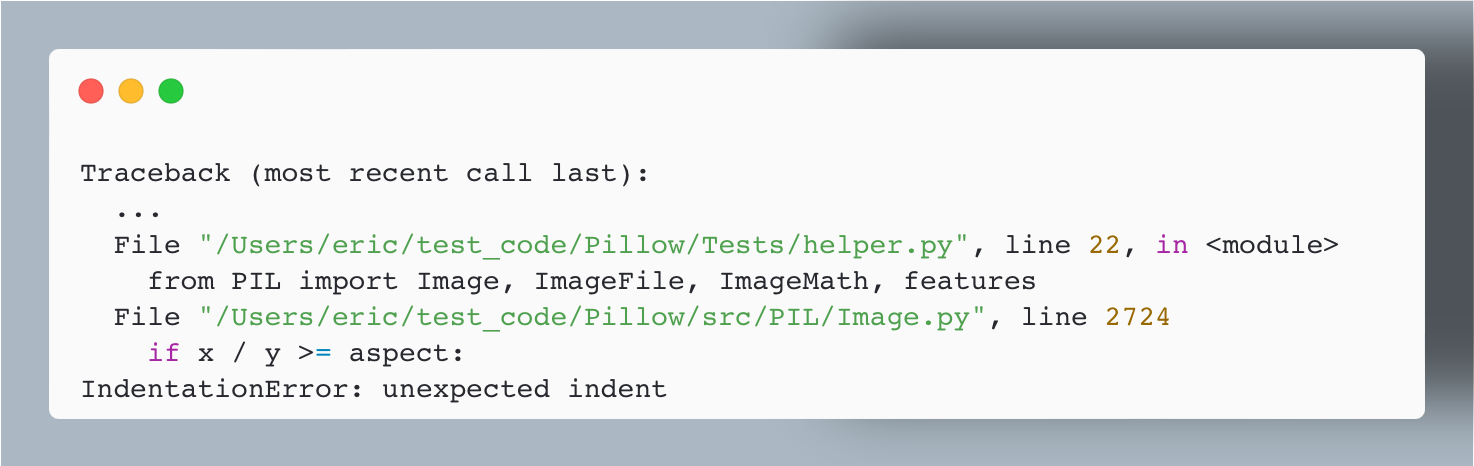
MP 145: Why third-party code appears in tracebacks, and what you can learn from it. Note: This post is part of an ongoing series about debugging in Python. The posts in this series will only be available to paid subscribers for the first 6 weeks. After that they will be| Mostly Python
In this new series of posts, I will share walkthroughs of debugging sessions I had to do at work to solve real-life problems, in the hope that both the process and the lessons learned will be useful to others working in the Scala ecosystem. The probl...| Pierre Ricadat's Tech Blog
Over and over, we’ve seen that teams who invest in adding rich, relevant context to their telemetry end up debugging faster and collaborating more effectively during incidents. Getting meaningful context added can feel like a big cross-team project, but some of the highest-leverage improvements don’t require app code changes or coordination across services. The post The Fast Path to More Useful Telemetry appeared first on Honeycomb.| Honeycomb
I migrated my Swift Vapor app from Fly.io’s regular Postgres to their new Managed Postgres service. As could be expected, this did not go smoothly, so below is a quick guide and the associated debugging story.| twocentstudios.com
Tracing a program with strace generates a lot of output because of the sheer number of syscalls every program calls during its runtime. This can become overwhelming very quickly, making it hard to analyze the trace and find what you are looking for. Fortunately, strace has several features that allow you to limit which syscalls … Continue reading Limiting which Syscalls to Trace with Strace| Abstract Expression
One of the great strengths of strace as a debugging tool is that it shows you what a program is doing regardless of whether it was compiled with debug info or not. The downside of this is that you only see the program’s syscall. You can use this information to deduce what is happening in … Continue reading Finding out where Syscalls are Called From: Stack Traces with Strace| Abstract Expression
There is probably no debugging tool on Linux that is more valuable and versatile than strace. This tool shows us all the calls a program makes to the operating system, including the data it transmits to the operating system via these calls and the return values sent back by the OS. Therefore, it can give … Continue reading Introduction to Strace| Abstract Expression
Most programmers prefer to write code over debugging it. Unfortunately, code breaks a lot more often than we would like and it often breaks in situations that are hard to debug. Therefore, an essential skill as a programmer is to know how to debug your code (and that of others). When facing our first bug … Continue reading Getting started with GDB| Abstract Expression
MP 144: What happens when you fix a bug, only to find another bug right away? Note: This post is part of an ongoing series about debugging in Python. The posts in this series will only be available to paid subscribers for the first 6 weeks. After that they will| Mostly Python
We recently ran across a strange higgs-bugson that manifested itself in a critical system that stores and distributes the firm’s trading activity data, calle...| Jane Street Blog
If, like me, you have a newer Intel hybrid CPU, with P-Cores and E-Cores, you may hit an issue running rr in Linux to debug things. Here is how to solve it. About rr If you haven’t used it before, and you are used to using gdb to debug, you should definitely try out rr. […] Source| LinuxJedi's /dev/null
This blog post describes a recent debugging session that led through a surprising set of issues involving Bash, `getcwd()`, and OverlayFS. What started as a simple customer bug report turned into a deep dive worth sharing.| sigma star gmbh
This two-part guide shows how to set up VS Code with the ESP-IDF extension to debug Espressif boards using JTAG. In this second part, we will debug a simple project using gdb through Espressif’s VSCode extension. We will explore the debugging options for navigating the code and inspecting the variables.| Developer Portal
MP 143: How do you find a bug in a larger project? Note: This post is part of an ongoing series about debugging in Python. The posts in this series will only be available to paid subscribers for the first 6 weeks. After that they will be available to everyone.| Mostly Python
I have been using IntelliJ Idea at work for a decade or so by now, and it’s been a reliable companion. JetBrains IDEs have a bit of a reputation for being slow, but their feature set is incredible: powerful refactoring tools, a great VCS UI (though I like magit even more!), a huge number of supported frameworks, integration with just about any testing library for any language, code coverage tools, powerful debuggers, etc.| Andrea Bergia's Website
Recently, I have been building software without libc to better understand Linux syscalls and internals better. So far, I have built a minimal shell, terminal Snake game, pure ARM64 assembly HTTP server and threads implementation. I have been using strace extensively while debugging. Useful options and flags I use a version of the following command: strace -fintrCDTYyy -o strace.log -v -s128 ./binary This looks like an alphabet soup of options! Here’s what they do and how they are useful: -f...| A Random Walk
Chrome Returns 206 when the Server Returns 403 Postmortem It is a feature not a bug! I got detailed explanation from chrome developers which is very helpful. You may find the complete response in the bug ticket. Also this blog post draws a lot of attention after I post it on Hackers News. You may find comments here. Updates: I did know the people who replied my issue are not the developers as pointed out by a HN comment.| Ao Li
Flamegraphs are great way to visualize resource consumption in your program and I am their big fan (I have written about them on two occasions – here and here). My biggest concern with flamegraphs is when the tooling is bad or missing: to create flamegraphs, you need to have a good profiler and a binary… Read The post FIYA – Flamegraphs in Your App appeared first on Johnny's Software Lab.| Johnny's Software Lab
Eine der Fragen, die ich in verschiedenen Gelegenheiten häufig höre, ist diese: „Welches Plugin verwendest Du auf jeder Website?“. Darauf habe ich normalerweise keine Antwort, da es meiner Meinung nach kein „Pflicht-Plugin“ gibt. Aber ein Plugin, das ich fast immer … Weiterlesen →| Kau-Boys
There’s a hardware problem affecting Intel 13th/14th gen CPUs, mostly desktop ones. This made the rounds through the press last year and has been on forums etc. for much longer than that. For…| The ryg blog
The Fiddler Web Debugger is now old enough to drink, but I still use it pretty much every day. Fiddler hasn’t aged entirely gracefully as platforms and standards have changed over the decades…| text/plain
MP 140: How can we take a systematic approach to a "simple" bug? Note: This post is part of an ongoing series about debugging in Python. The posts in this series will only be available to paid subscribers for the first 6 weeks. After that they will be available to| Mostly Python
Tired of vague bug reports like "it doesn't work"? In this post, you'll learn how to collect automatic logs and track real-world errors in your Swift apps—with just a few lines of code.| FlineDev Blog – Insights on Swift, Xcode, and Apple Development
Discover how to turn Typed Throws from a headache into a superpower — with clean error handling and powerful debugging insights.| FlineDev Blog – Insights on Swift, Xcode, and Apple Development
I have created plugin and had to debug my C# code. Setting up debug process is complex. Microsoft offers good instructions but there were some things that I just had to figure out myself. I will tell you all my... Continue Reading →| Karl-Johan Spiik, Microsoft MVP
MP 139: A systematic, inquisitive approach makes debugging simple issues easier, and complex bugs possible. Note: This post is part of an ongoing series about debugging in Python. The posts in this series will only be available to paid subscribers for the first 6 weeks. After that they will be| Mostly Python
Reading Time: 6minutesDebugging virtual keyboards can be tricky because each framework – Flutter, React Native, and native iOS/Android – handles input, rendering, and events differently. Here’s how you can tackle common challenges: Quick Comparison Feature Flutter React... The post Framework-Specific Debugging for Virtual Keyboards appeared first on Fleksy.| Fleksy
In my previous post I talked about why Console.log() isn’t the most effective debugging tool. In this installment, we will do a bit of an about-face and discuss the ways in which Console.log() is fantastic. Let’s break down some essential concepts an...| Java, Debugging, DevOps & Open Source
As a Java developer most of my focus is on the backend side of debugging. Front-end debugging poses different challenges and has sophisticated tools of its own. Unfortunately, print based debugging has become the norm in front-end. To be fair, it mak...| Java, Debugging, DevOps & Open Source
Full stack development is often likened to an intricate balancing act, where developers are expected to juggle multiple responsibilities across the frontend, backend, database, and beyond. As the definition of full stack development continues to evol...| Java, Debugging, DevOps & Open Source
As Kubernetes continues to revolutionize the way we manage and deploy applications, understanding its intricacies becomes essential for developers and operations teams alike. If you don't have a dedicated DevOps team you probably shouldn't be working...| Java, Debugging, DevOps & Open Source
Debugging application issues in a Kubernetes cluster can often feel like navigating a labyrinth. Containers are ephemeral by design, intended to be immutable once deployed. This presents a unique challenge when something goes wrong and we need to dig...| Java, Debugging, DevOps & Open Source
While debugging in an IDE or using simple command line tools is relatively straightforward, the real challenge lies in production debugging. Modern production environments have enabled sophisticated self-healing deployments, yet they have also made t...| Java, Debugging, DevOps & Open Source
Failures in software systems are inevitable. How these failures are handled can significantly impact system performance, reliability, and the business’s bottom line. In this post I want to discuss the upside of failure. Why you should seek failure, w...| Java, Debugging, DevOps & Open Source
Debugging is not just about identifying errors—it's about instituting a reliable process for ensuring software health and longevity. In this post we discuss the role of software testing in debugging, including foundational concepts and how they conve...| Java, Debugging, DevOps & Open Source
jhsdb is a relatively underexplored yet incredibly powerful tool for debugging JVM issues. Whether you're tackling native code that crashes the JVM or delving into complex performance analysis, understanding how to use jhsdb effectively can be a game...| Java, Debugging, DevOps & Open Source
I blogged about Java Stream debugging in the past but I skipped an important method that's worthy of a post of its own: peek. This blog post delves into the practicalities of using peek() to debug Java streams, complete with code samples and common p...| Java, Debugging, DevOps & Open Source
Debugging effectively requires a nuanced approach, similar to using tongs that tightly grip the problem from both sides. While low-level tools have their place in system-level service debugging, today's focus shifts towards a more sophisticated segme...| Java, Debugging, DevOps & Open Source
We don't usually think of Git as a debugging tool. Surprisingly, Git shines not just as a version control system but also as a potent debugging ally when dealing with the tricky matter of regressions. https://youtu.be/yZuPHEBbjYI As a side note, if...| Java, Debugging, DevOps & Open Source
"The most effective debugging tool is still careful thought, coupled with judiciously placed print statements." -- Brian Kernighan. Cutting a patient open and using print for debugging used to be the best ways to diagnose problems. If you still adv...| Java, Debugging, DevOps & Open Source
In the realm of system debugging, particularly on Linux platforms, strace stands out as a powerful and indispensable tool. Its simplicity and efficacy make it the go-to solution for diagnosing and understanding system-level operations, especially whe...| Java, Debugging, DevOps & Open Source
Explore the power of DTrace for system debugging and optimization: A comprehensive guide on its capabilities, performance, and applications.| Java, Debugging, DevOps & Open Source
In 1977, Commodore released the PET computer, a quirky home computer that combined the processor, a tiny keyboard, a cassette drive for st...| www.righto.com
MP 138: Debugging is often learned "on the job", but you can learn a lot with structured practice. Note: This is the first post in a series about debugging. This post is free to everyone, but the remainder of the series will be available to paid subscribers only for the| Mostly Python
Over the past 5 years, we’ve had many incredible opportunities to engage with game developers. From AAA studios to indie developers, the passion for slashing iteration times is significant. Amidst all the fantastic feedback we’ve received for Visual Studio, one sentiment has rung loud and clear: a desire to debug optimized C++ code without sacrificing […]| C++ Team Blog
All of a sudden, without any ostensible cause, Google Docs was flooded with errors. How it took me 2 days and a coworker to solve the hardest bug I ever debugged.| www.clientserver.dev
Its been a week of frustration, but also success. We always have a perennial problem of broken apps, which work ok on the average home network, but as soon as you try to secure things you hit problems. Although there is a good argument for keeping school networks fairly permissive, realistically schools can't just turn off their firewall and let everyone at it - not only would the school be failing in their duty of care, but it would be a security nightmare too.| Steve's Blog
What's new in Ruby 3.2's IRB? IRB 1.6 has been released and will become Ruby 3.2's built-in IRB version. It and a few recent releases include many enhancements @k0kubun and I made, and I want to introduce them in this article: New Commands In recent ...| Mostly Ruby DX
Owning a production Postgres database is never boring. The other day, I’m looking for trouble (as I am wont to do), and I notice this weird curve in the production database metrics: So weR…| Dan Slimmon
I recently wrote an article on debugging Emacs commands. In it I mentioned M-x toggle-debug-on-error and debug-on-error briefly, but after posting the article I realized that many people probably don’t understand how this works exactly. The obvious thing that happens when debug-on-error is enabled is that when an error happen you’re seeing its backtrace (or stacktrace, depending on the terminology you prefer). What’s not so obvious (even, if it’s in the name) is that this buffer is ac...| Emacs Redux
I covered our migration to Scala 3 extensively in my last blog post, but we deployed the migrated code to production only a week ago. Such releases are always a little stressful because you never know what kind of unexpected bug can occur, and on top...| Pierre Ricadat's Tech Blog
Last night I was running our usual Greybeard AMA on FreeBSD’s Discord server, when someone asked “I’ve been using Linux for years, but I also like FreeBSD. what can I do for FreeBSD, and what can FreeBSD do for me, as a Python Full Stack Developer?” I started talking about FreeBSD Jails, ZFS, Boot Environments […]| Antranig Vartanian
I was helping someone get my gokrazy/rsync implementation set up to synchronize RPKI data (used for securing BGP routing infrastructure), when we discovered that with the right invocation, my rsync receiver would just hang indefinitely. This was a quick problem to solve, but in the process, I realized that I should probably write down a few Go debugging tips I have come to appreciate over the years!| Michael Stapelberg
In which we use System.Runtime.CompilerServices.Unsafe a generic API (“type-safe” but still “unsafe”) and mess with the C# Type System!| Performance is a Feature!
If you’ve ever spent time debugging .NET memory dumps in WinDBG you will be familiar with the commands shown below, which aren’t always the most straight-forward to work with!| Performance is a Feature!