Techniques for scoring a regression model in SAS - The DO Loop
My previous post described how to use the "missing response trick" to score a regression model.| The DO Loop
My previous post described how to use the "missing response trick" to score a regression model.| The DO Loop
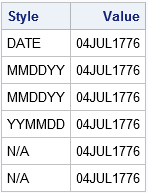
If you obtain data from web sites, social media, or other unstandardized data sources, you might not know the form of dates in the data.| The DO Loop
Last week I discussed how to create spaghetti plots in SAS.| The DO Loop
Have you ever looked as a statistical graph that uses bright garish colors and thought, "Why in the world did that guy choose those awful colors?| The DO Loop

Statistical programmers need to access numerical constants that help us to write robust and accurate programs.| The DO Loop
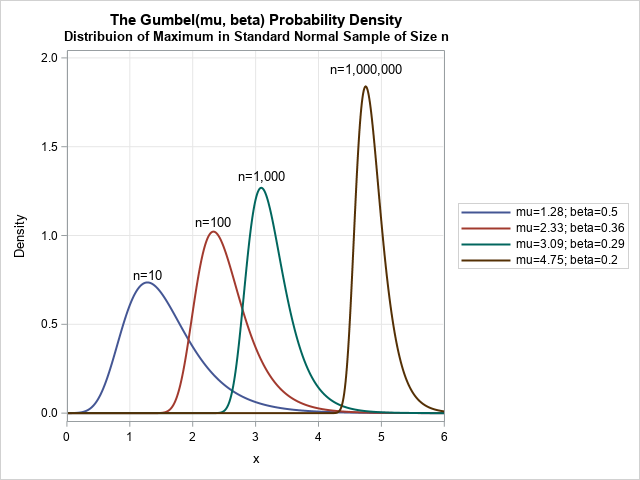
SAS supports more than 25 common probability distributions for the PDF, CDF, QUANTILE, and RAND functions.| The DO Loop
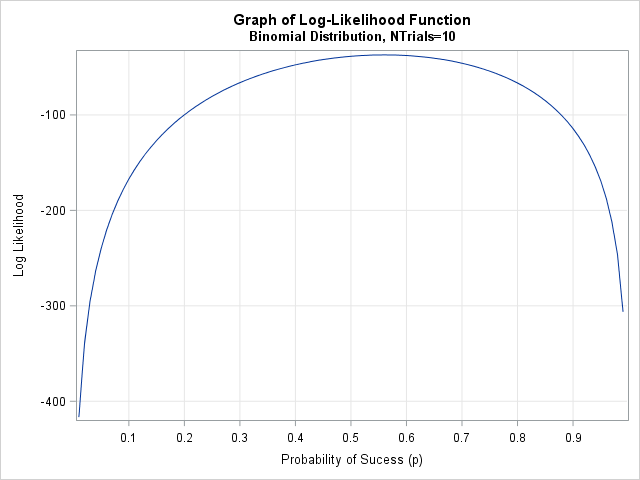
Maximum likelihood estimation (MLE) is a powerful statistical technique that uses optimization techniques to fit parametric models.| The DO Loop
Occasionally a SAS statistical programmer will ask me, "How can I construct a large correlation matrix?| The DO Loop
When I was at SAS Global Forum last week, a SAS user asked my advice regarding a SAS/IML program that he wrote.| The DO Loop
SAS has several procedures that can fit a probability distribution to data, plot a histogram, and overlay one or more density estimates: PROC UNIVARIATE in Base SAS enables you to overlay parametric density curves from about 20 common continuous probability distributions, such as normal, lognormal, and gamma. It also enables you to overlay a nonparametric kernel density estimate. PROC SEVERITY in SAS/ETS software enables you to overlay density curves for severity models. It also enables you t...| The DO Loop
The power method is a well-known iterative scheme to approximate the largest eigenvalue (in absolute value) of a symmetric matrix.| The DO Loop
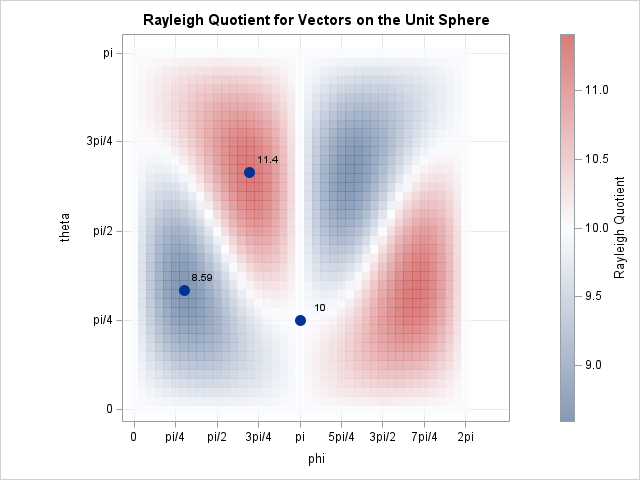
When I encounter a new function, I usually graph it to gain intuition about how the function transforms its inputs. Recently, I needed to use the Rayleigh quotient function, which is connected to the estimation of eigenvalues and eigenvectors for symmetric matrices. It has been several years since I last thought about the Rayleigh quotient, so this article shows how to visualize the function in SAS for 2 x 2 and 3 x 3 symmetric matrices. What is the Rayleigh quotient? The Rayleigh quotien...| The DO Loop
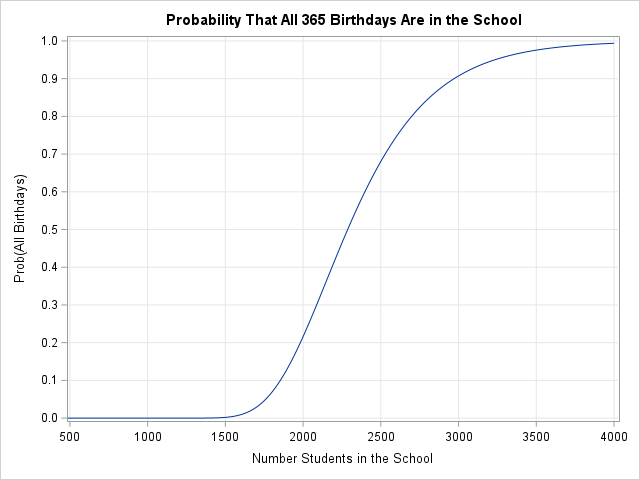
The new school year had barely started when I got a call from a friend who is an elementary school principal. She told me that every morning she announces the names of students who are celebrating a birthday. "One student noticed that we've already had two days on which no student has a birthday," she said. "With 900 students in the school, she thought that at least one birthday should be announced every day. She wants to know more about the math for this situation." What a great question! Th...| The DO Loop
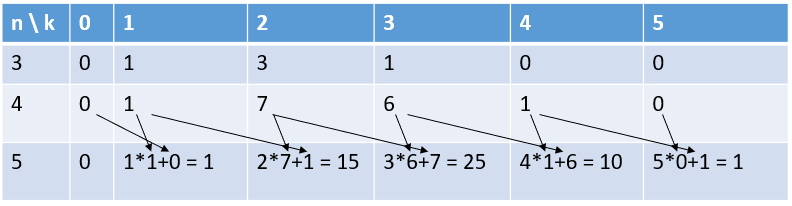
In probability and statistics, special numbers are used to compute probabilities by counting the number of ways certain events can occur.| The DO Loop
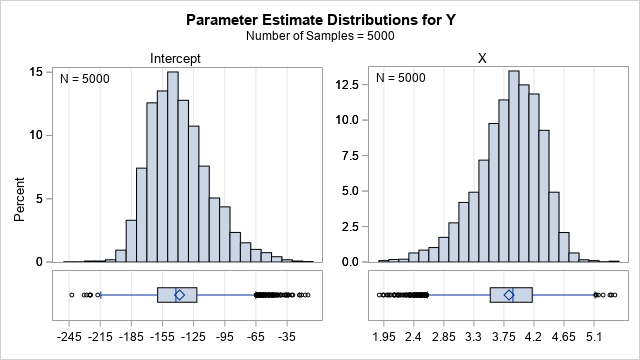
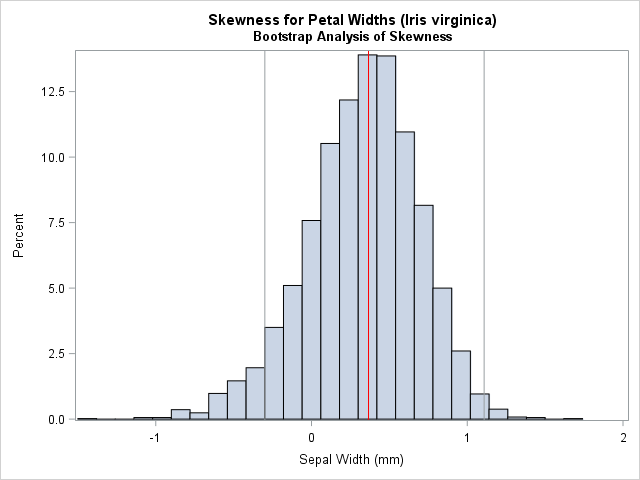
I've written many articles about bootstrapping in SAS, including several about bootstrapping in regression models.| The DO Loop
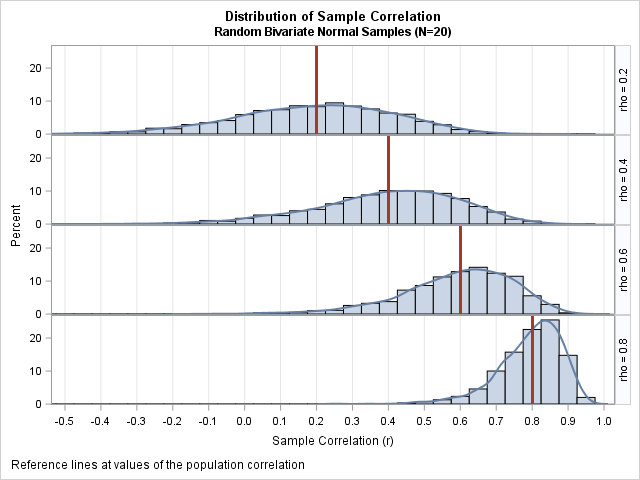
Pearson's correlation measures the linear association between two variables.| The DO Loop
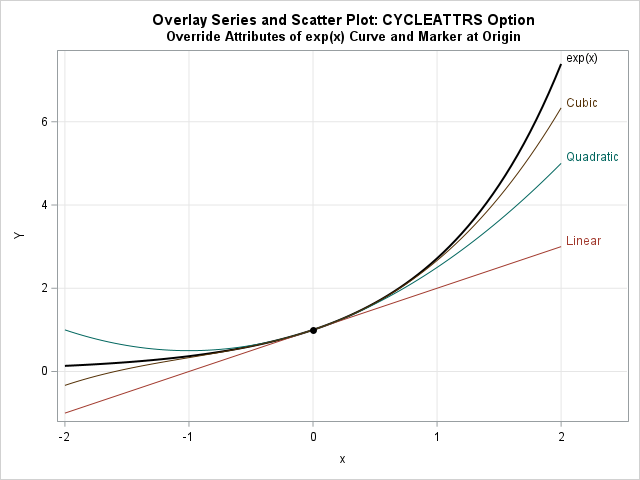
I've often wondered about the logic that the SGPLOT procedure in SAS uses to determine whether a set of graphical overlays will receive identical attributes or different attributes. (Recall that color, size, line style, and marker symbol are all examples of attributes.) I know that when you plot grouped data ("long-form" data by using the GROUP= option), each component of the plot gets a unique attributes by default. The situation is less clear when you are plotting wide data (multiple variab...| The DO Loop

In data analysis, sometimes we need to perform a preliminary task before we can analyze data.| The DO Loop
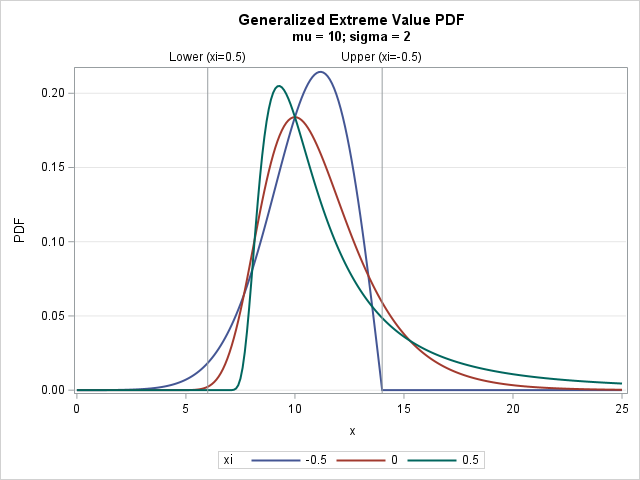
SAS supports more than 25 common probability distributions for the PDF, CDF, QUANTILE, and RAND functions. If you need a less-common distribution, you can implement new distributions by using Base SAS (specifically, PROC FCMP) or the SAS/IML language. On the SAS Support Communities, a SAS programmer asked how to implement the generalized extreme value (GEV) distribution in SAS. This article shows how to use PROC FCMP and PROC IML to implement functions for working with the GEV distribution. T...| The DO Loop
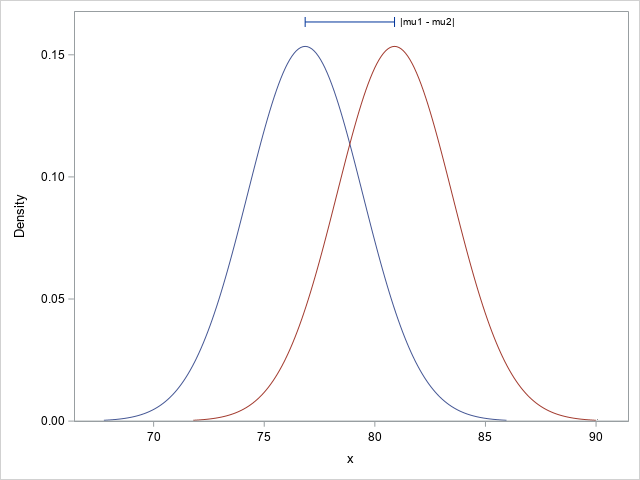
A previous article discusses Cohen's d statistic and how to compute it in SAS. For a two-sample independent design, Cohen's d estimates the standardized mean difference (SMD). Because Cohen's d is a biased statistic, the previous article also computes Hedges' g, which is an unbiased estimate of the SMD. Lastly, the article discusses how to estimate the standard error of the statistic. Today's article extends the analysis by showing how to compute a confidence interval (CI) for Cohen's d (and ...| The DO Loop
What is Cohen's d statistic and how is it used?| The DO Loop
The recent releases of SAS 9.| The DO Loop
Gambling games that use dice, such as the game of "craps," are often used to demonstrate the laws of probability.| The DO Loop

A SAS programmer wanted to simulate samples from a family of Beta(a,b) distributions for a simulation study.| The DO Loop
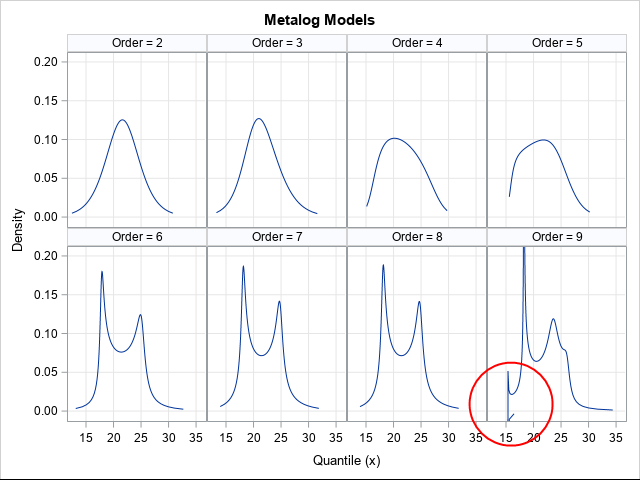
The metalog family of distributions (Keelin, Decision Analysis, 2016) is a flexible family that can model a wide range of continuous univariate data distributions when the data-generating mechanism is unknown.| The DO Loop
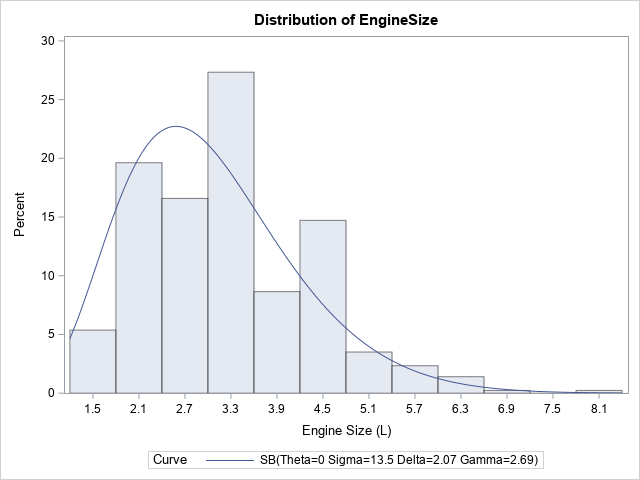
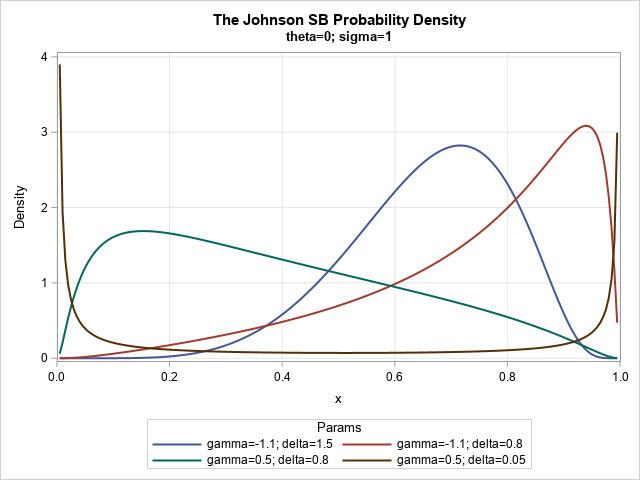
The Johnson system (Johnson, 1949) contains a family of four distributions: the normal distribution, the lognormal distribution, the SB distribution, and the SU distribution.| The DO Loop
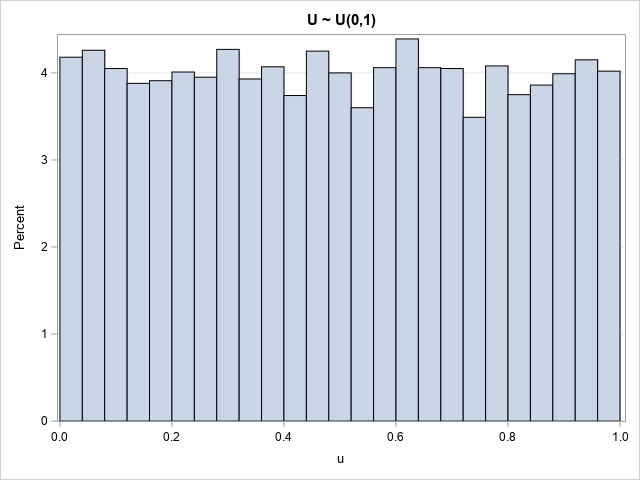
This article uses simulation to demonstrate the fact that any continuous distribution can be transformed into the uniform distribution on (0,1).| The DO Loop
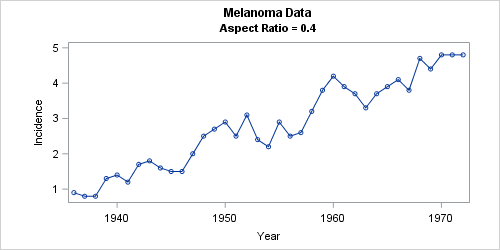
In SAS, the aspect ratio of a graph is the physical height of the graph divided by the physical width.| The DO Loop

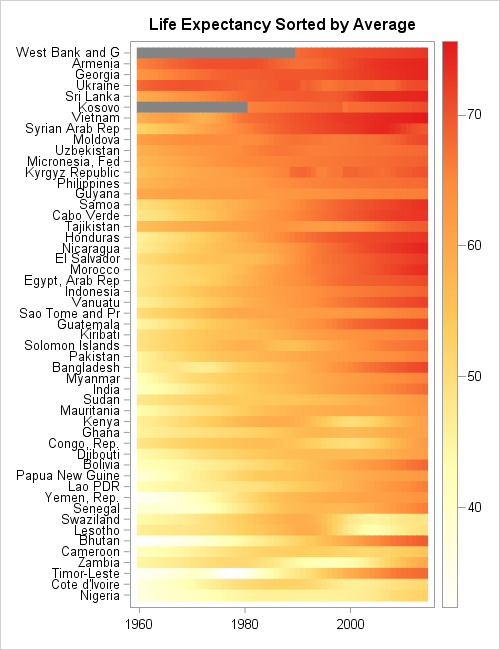
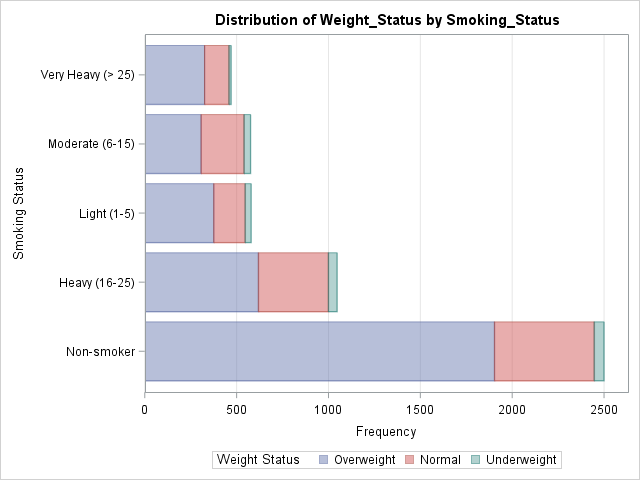
Most introductory statistics courses introduce the bar chart as a way to visualize the frequency (counts) for a categorical variable.| The DO Loop

Parameters in SAS procedures are specified a list of values that you manually type into the procedure syntax.| The DO Loop
SAS provides procedures to fit common probability distributions to sample data.| The DO Loop
Many common probability distributions contain terms that increase or decrease quickly, such as the exponential function and factorials.| The DO Loop
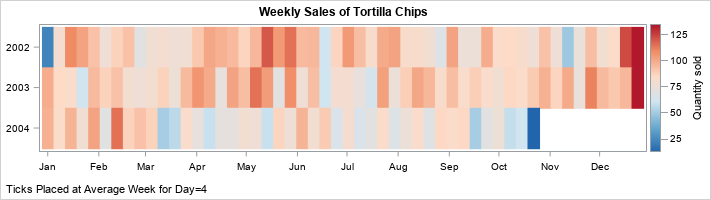
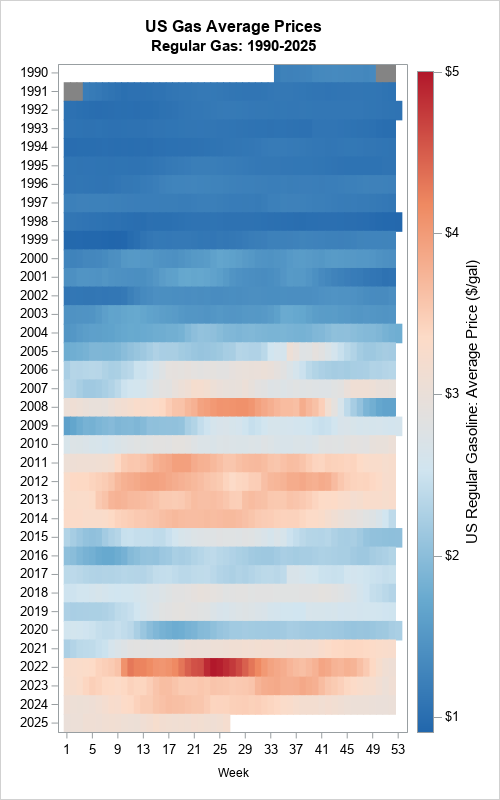
Suppose you measure data weekly.| The DO Loop
Dating can be a challenge.| The DO Loop
I follow several data visualization experts on social media.| The DO Loop
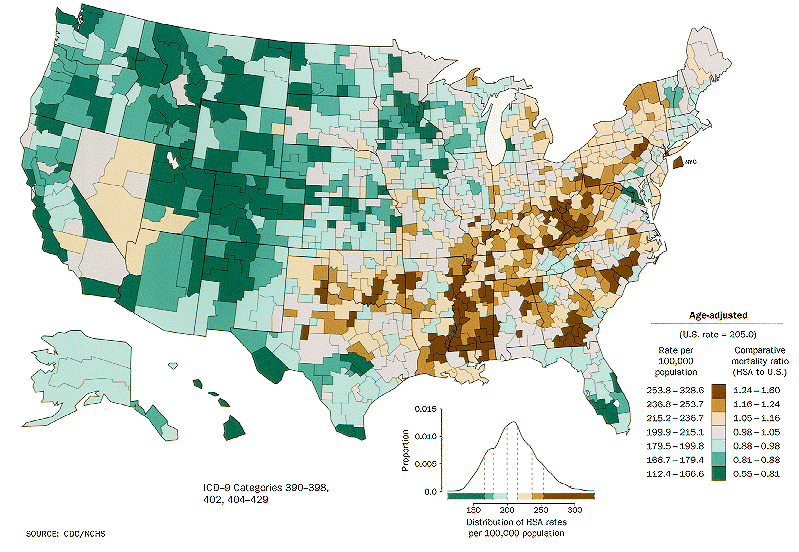
An article by David Corliss in Amstat News (Corliss D.| The DO Loop
SAS software provides many run-time functions that you can call from your SAS/IML or DATA step programs.| The DO Loop
Newton's method was in the news this week.| The DO Loop
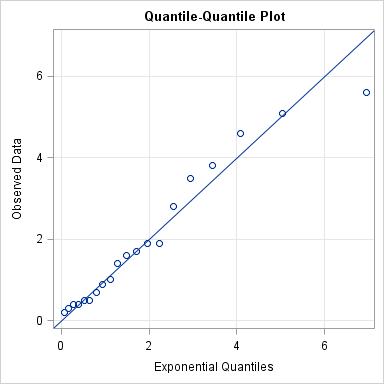
"I think that my data are exponentially distributed, but how can I check?| The DO Loop
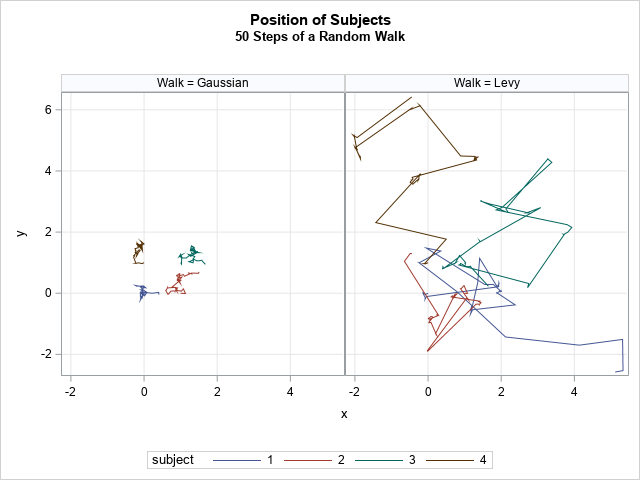
Imagine an animal that is searching for food in a vast environment where food is scarce.| The DO Loop
The tail of a probability distribution is an important notion in probability and statistics, but did you know that there is not a rigorous definition for the "tail"?| The DO Loop
In my previous post, I showed how to approximate a cumulative density function (CDF) by evaluating only the probability density function.| The DO Loop
A frequent topic on SAS discussion forums is how to check the assumptions of an ordinary least squares linear regression model.| The DO Loop
Since the late 1990s, SAS has supplied macros for basic bootstrap and jackknife analyses.| The DO Loop
In my article "Simulation in SAS: The slow way or the BY way," I showed how to use BY-group processing rather than a macro loop in order to efficiently analyze simulated data with SAS.| The DO Loop
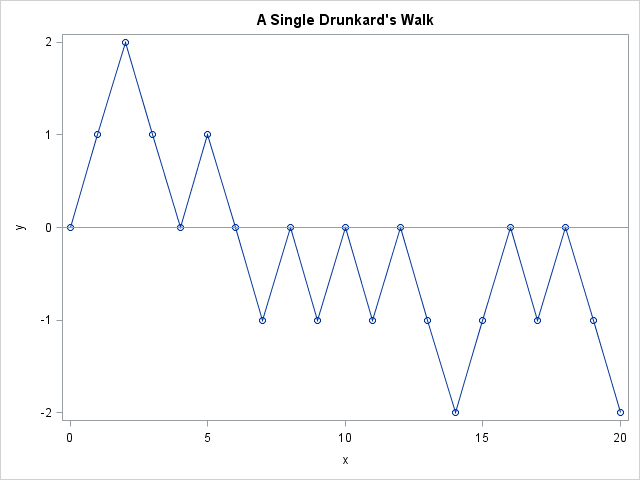
You've probably heard of a random walk, but have you heard about the drunkard's walk?| The DO Loop
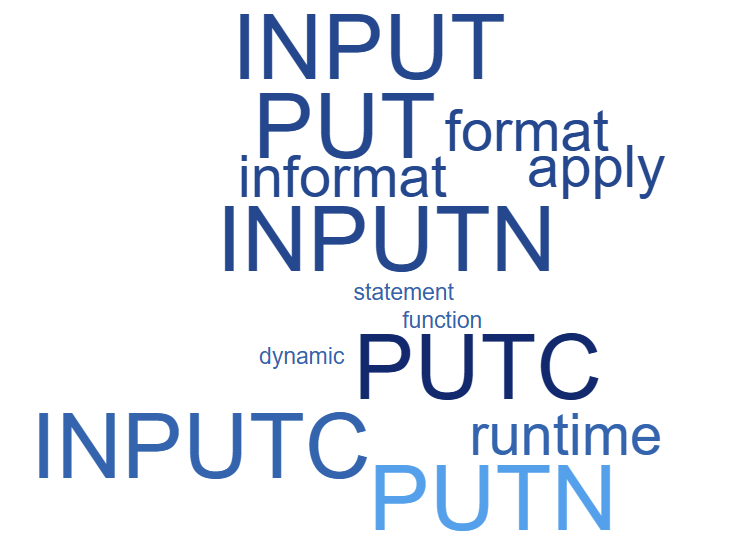
In SAS, the INPUT and PUT functions are powerful functions that enable you to convert data from character type to numeric type and vice versa.| The DO Loop
Over the past few years, and especially since I posted my article on eight tips to make your simulation run faster, I have received many emails (often with attached SAS programs) from SAS users who ask for advice about how to speed up their simulation code.| The DO Loop
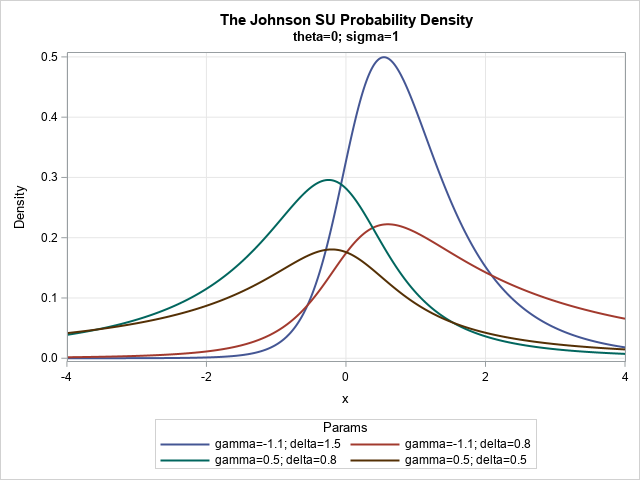
The Johnson system (Johnson, 1949) contains a family of four distributions: the normal distribution, the lognormal distribution, the SB distribution (which models bounded distributions), and the SU distribution (which models unbounded distributions).| The DO Loop
From the early days of probability and statistics, researchers have tried to organize and categorize parametric probability distributions.| The DO Loop
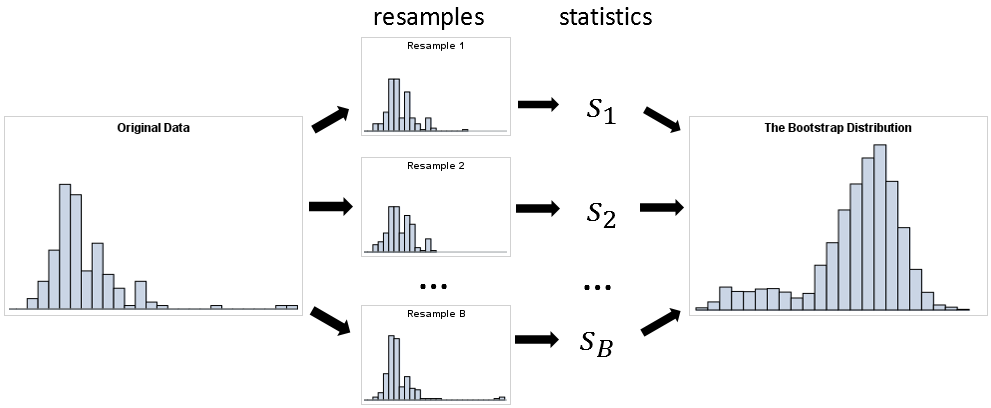
This article describes best practices and techniques that every data analyst should know before bootstrapping in SAS.| The DO Loop
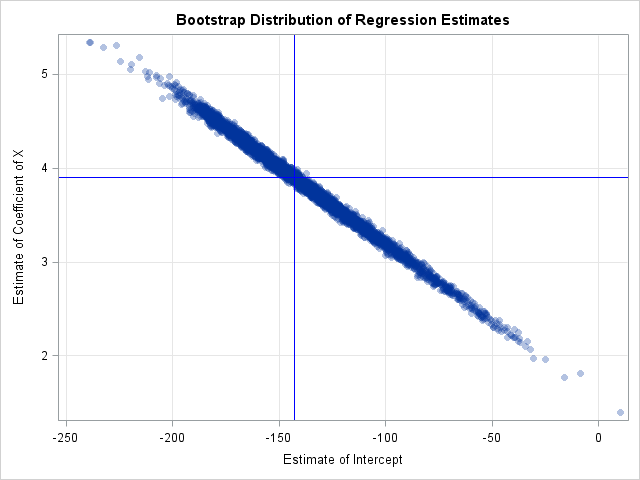
If you want to bootstrap the parameters in a statistical regression model, you have two primary choices.| The DO Loop
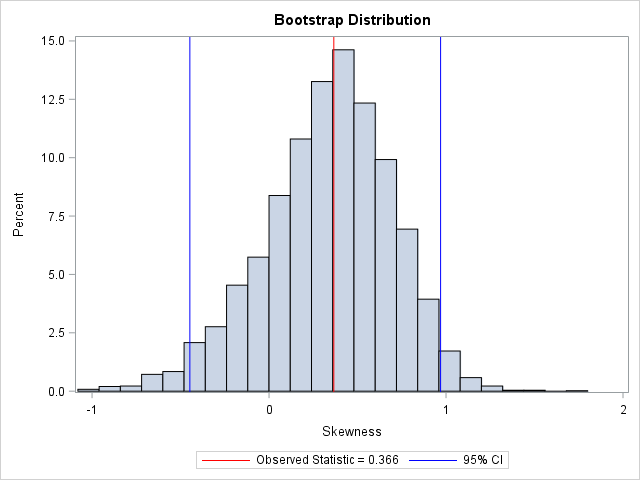
A common question is "how do I compute a bootstrap confidence interval in SAS?| The DO Loop
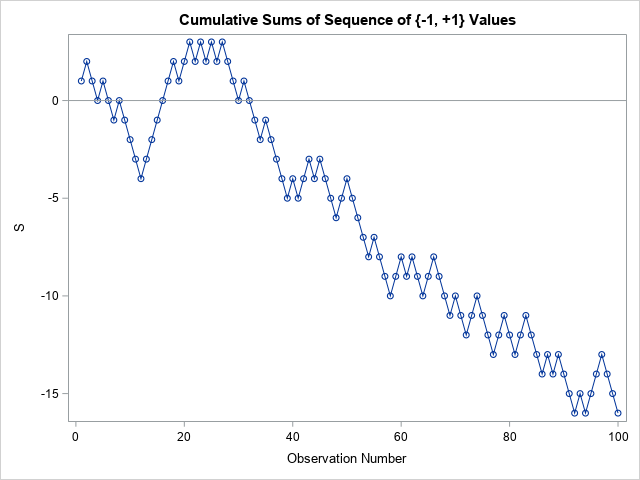
Many statistical tests use a CUSUM statistic as part of the test.| The DO Loop

To a statistician, the DIF function (which was introduced in SAS/IML 9.| The DO Loop
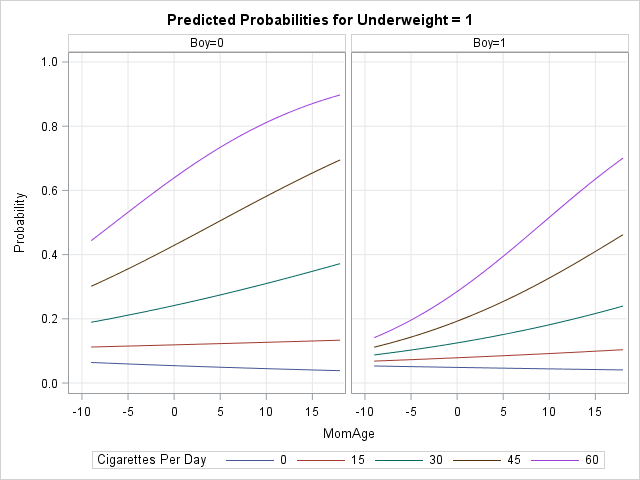
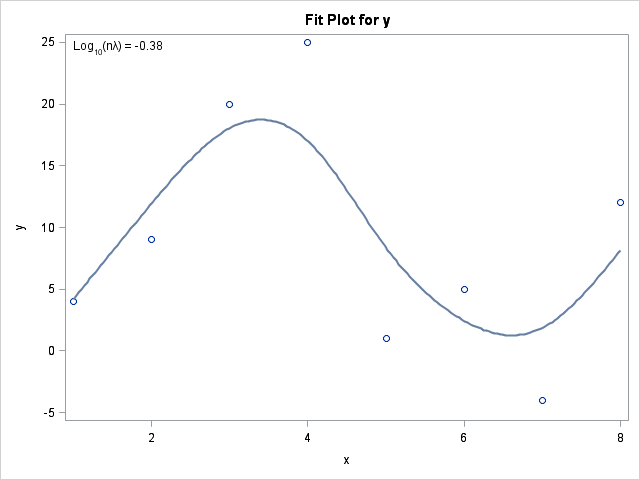
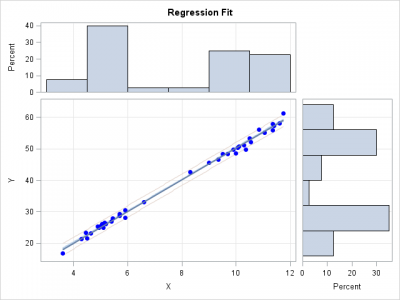
Graphs enable you to visualize how the predicted values for a regression model depend on the model effects.| The DO Loop

Just like the SAS DATA step, the SAS IML language supports both functions and subroutines.| The DO Loop

One of the most exciting features of SAS Viya Workbench is that the code editor includes a generative AI component called SAS Viya Copilot.| The DO Loop

A previous article discusses a formula for a confidence interval for R-square in a linear regression model (Olkin and Finn (1995) "Correlations redux", Psychological Bulletin) The formula is useful for large data sets, but should be used with caution for small samples.| The DO Loop
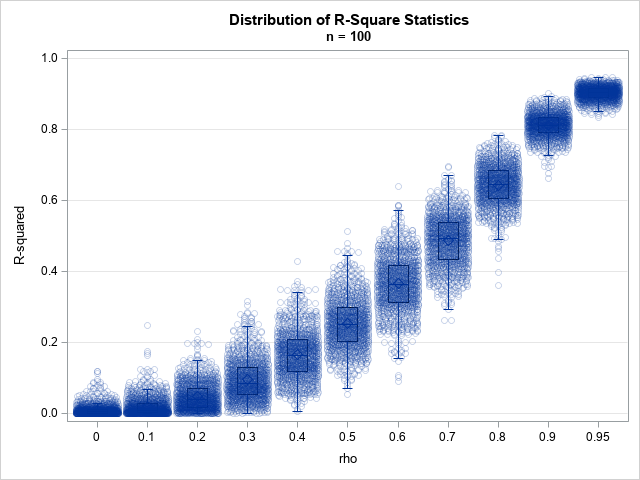
A SAS analyst ran a linear regression model and obtained an R-square statistic for the fit.| The DO Loop
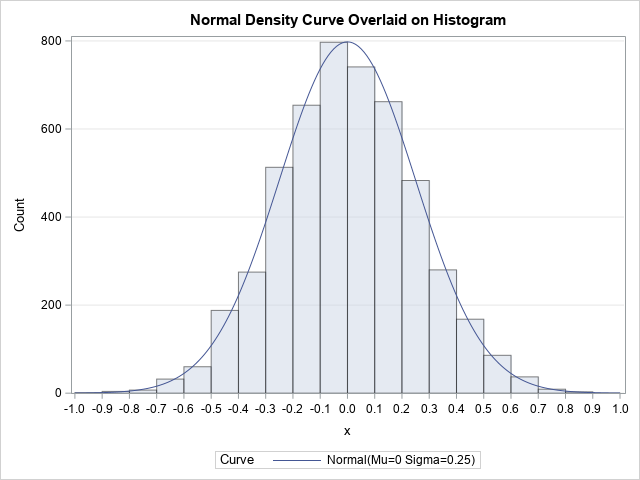
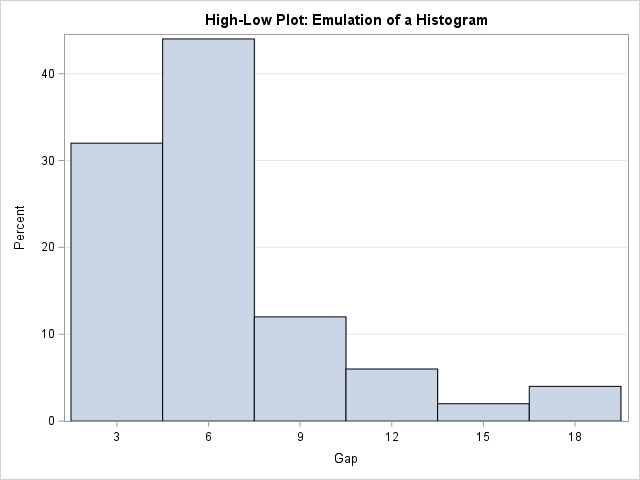
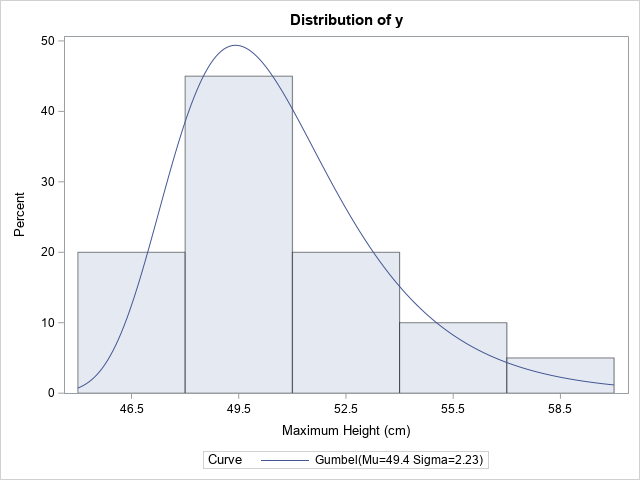
This article discusses how to scale a probability density curve so that it fits appropriately on a histogram, as shown in the graph to the right.| The DO Loop
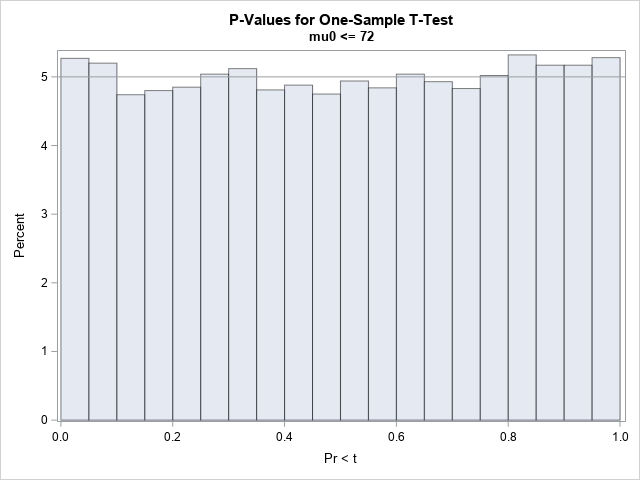
A SAS statistical programmer recently asked a theoretical question about statistics.| The DO Loop

At a recent conference in Las Vegas, a presenter simulated the sum of two dice and used it to simulate the game of craps.| The DO Loop

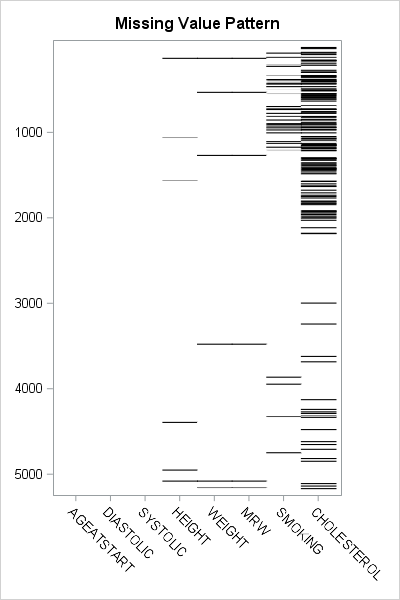
Years ago, I wrote an article that showed how to visualize patterns of missing data.| The DO Loop

The moment-ratio diagram is a tool that is useful when choosing a distribution that models a sample of univariate data.| The DO Loop