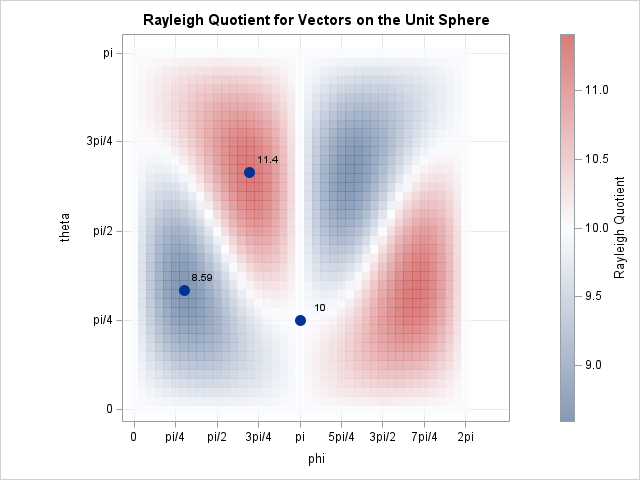
When I encounter a new function, I usually graph it to gain intuition about how the function transforms its inputs. Recently, I needed to use the Rayleigh quotient function, which is connected to the estimation of eigenvalues and eigenvectors for symmetric matrices. It has been several years since I last thought about the Rayleigh quotient, so this article shows how to visualize the function in SAS for 2 x 2 and 3 x 3 symmetric matrices. What is the Rayleigh quotient? The Rayleigh quotien...| The DO Loop
I've often wondered about the logic that the SGPLOT procedure in SAS uses to determine whether a set of graphical overlays will receive identical attributes or different attributes. (Recall that color, size, line style, and marker symbol are all examples of attributes.) I know that when you plot grouped data ("long-form" data by using the GROUP= option), each component of the plot gets a unique attributes by default. The situation is less clear when you are plotting wide data (multiple variab...| The DO Loop
Suppose you measure data weekly.| The DO Loop
I follow several data visualization experts on social media.| The DO Loop
Years ago, I wrote an article that showed how to visualize patterns of missing data.| The DO Loop