Login
From:
The DO Loop
(Uncensored)
subscribe
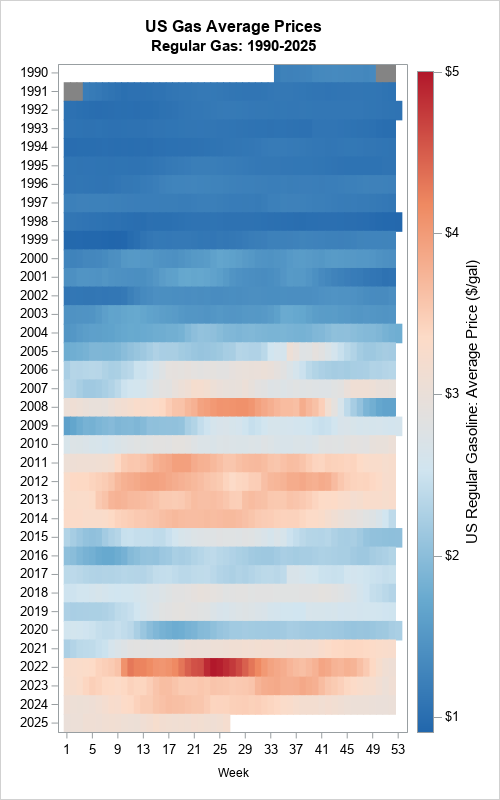
Use a lasagna plot to visualize US gas prices - The DO Loop
https://blogs.sas.com/content/iml/2025/07/14/lasagna-gas-prices.html
links
backlinks
Tagged with:
time series
statistical graphics
I follow several data visualization experts on social media.
Roast topics
Find topics
Roast it!
Roast topics
Find topics
Find it!
Roast topics
Find topics
Find it!