Login
From:
The Data Game
(Uncensored)
subscribe
Visualising NBA shot charts in Tableau | The Data Game
https://thedatagame.com.au/2015/10/07/visualising-nba-shot-charts-in-tableau/
links
backlinks
Tagged with:
basketball
sport
nba
tableau
visualisation
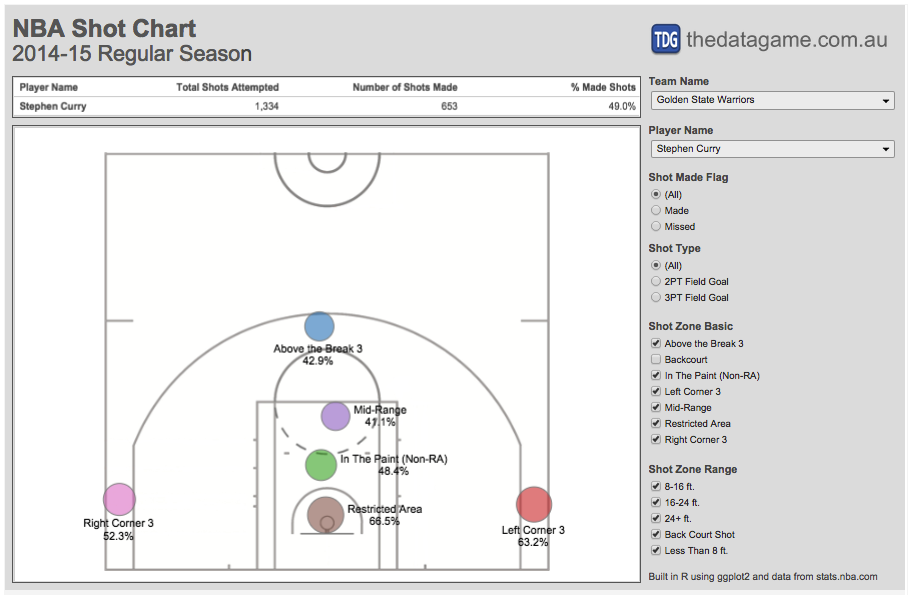
In my last post I produced some NBA shot charts in R using data scraped from stats.nba.com and ggplot2. This time I extracted all shot location data available for 490 players and linked it to a Tab…
Roast topics
Find topics
Roast it!
Roast topics
Find topics
Find it!
Roast topics
Find topics
Find it!